ENVIRONMENTAL SCIENCE · CHAPTER 5
Sea Otters and Kelp Lab
Follow along with your worksheet, one question at a time.
mrsajdak.com/otters
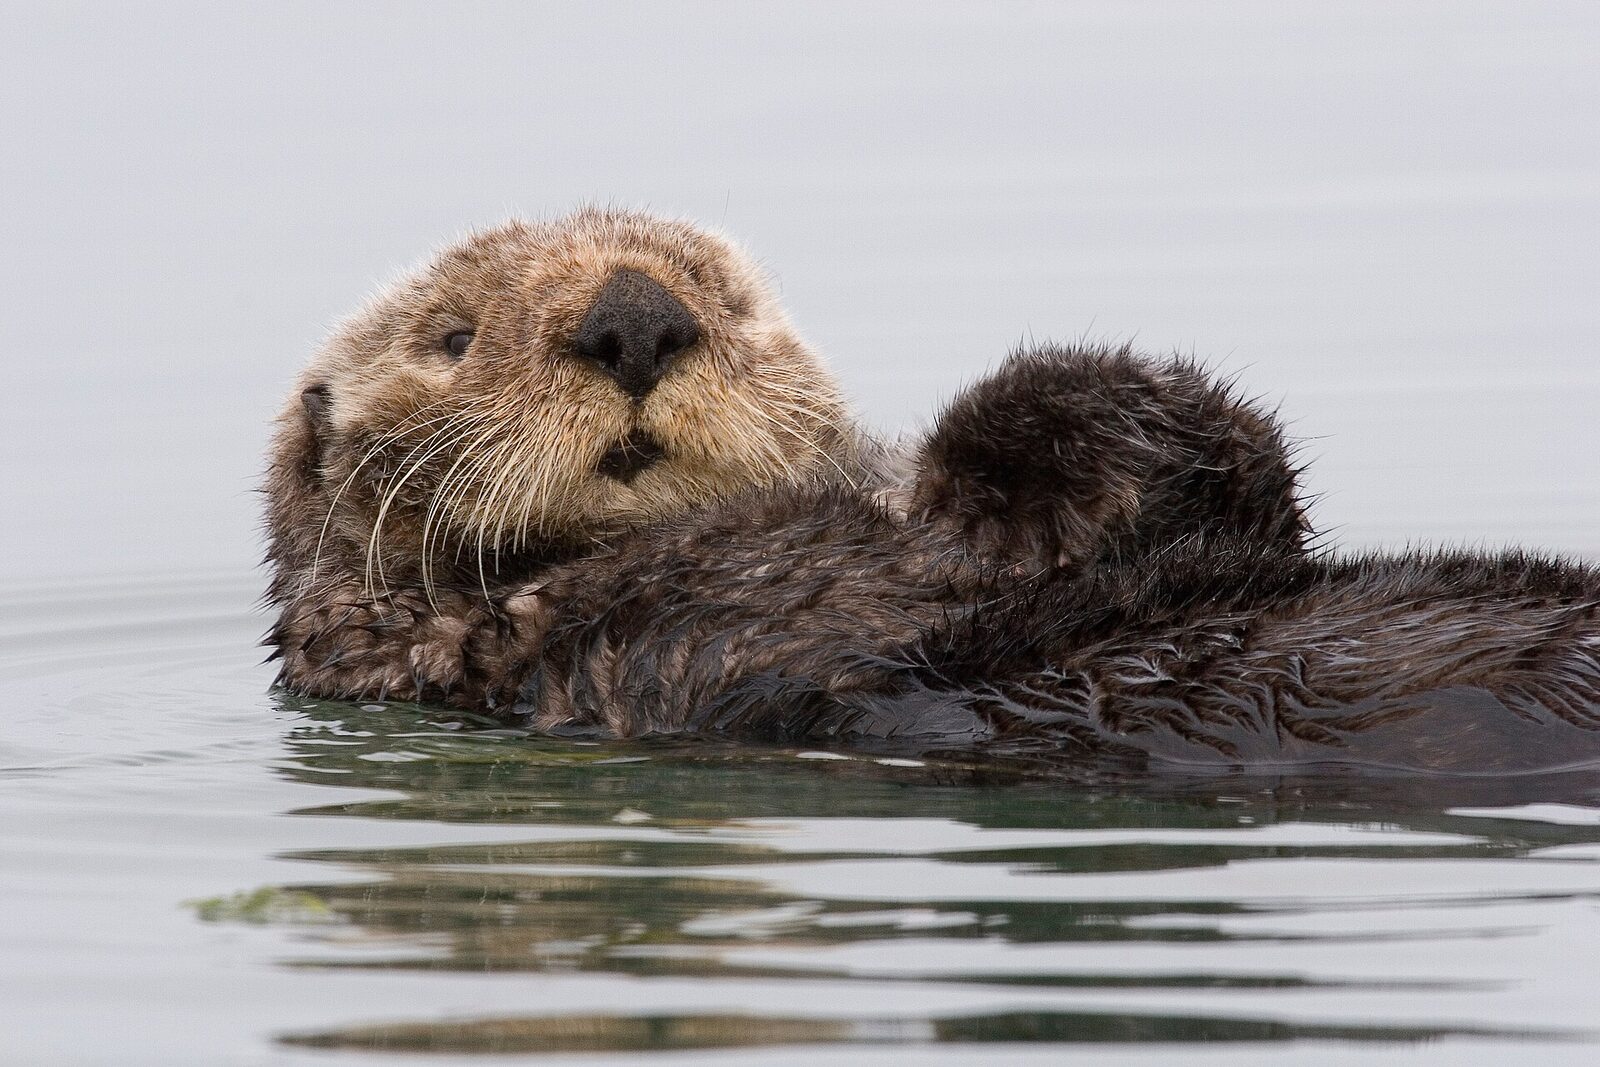
Photo: Mike Baird, CC BY 2.0
BEFORE YOU START
Who eats whom
eats
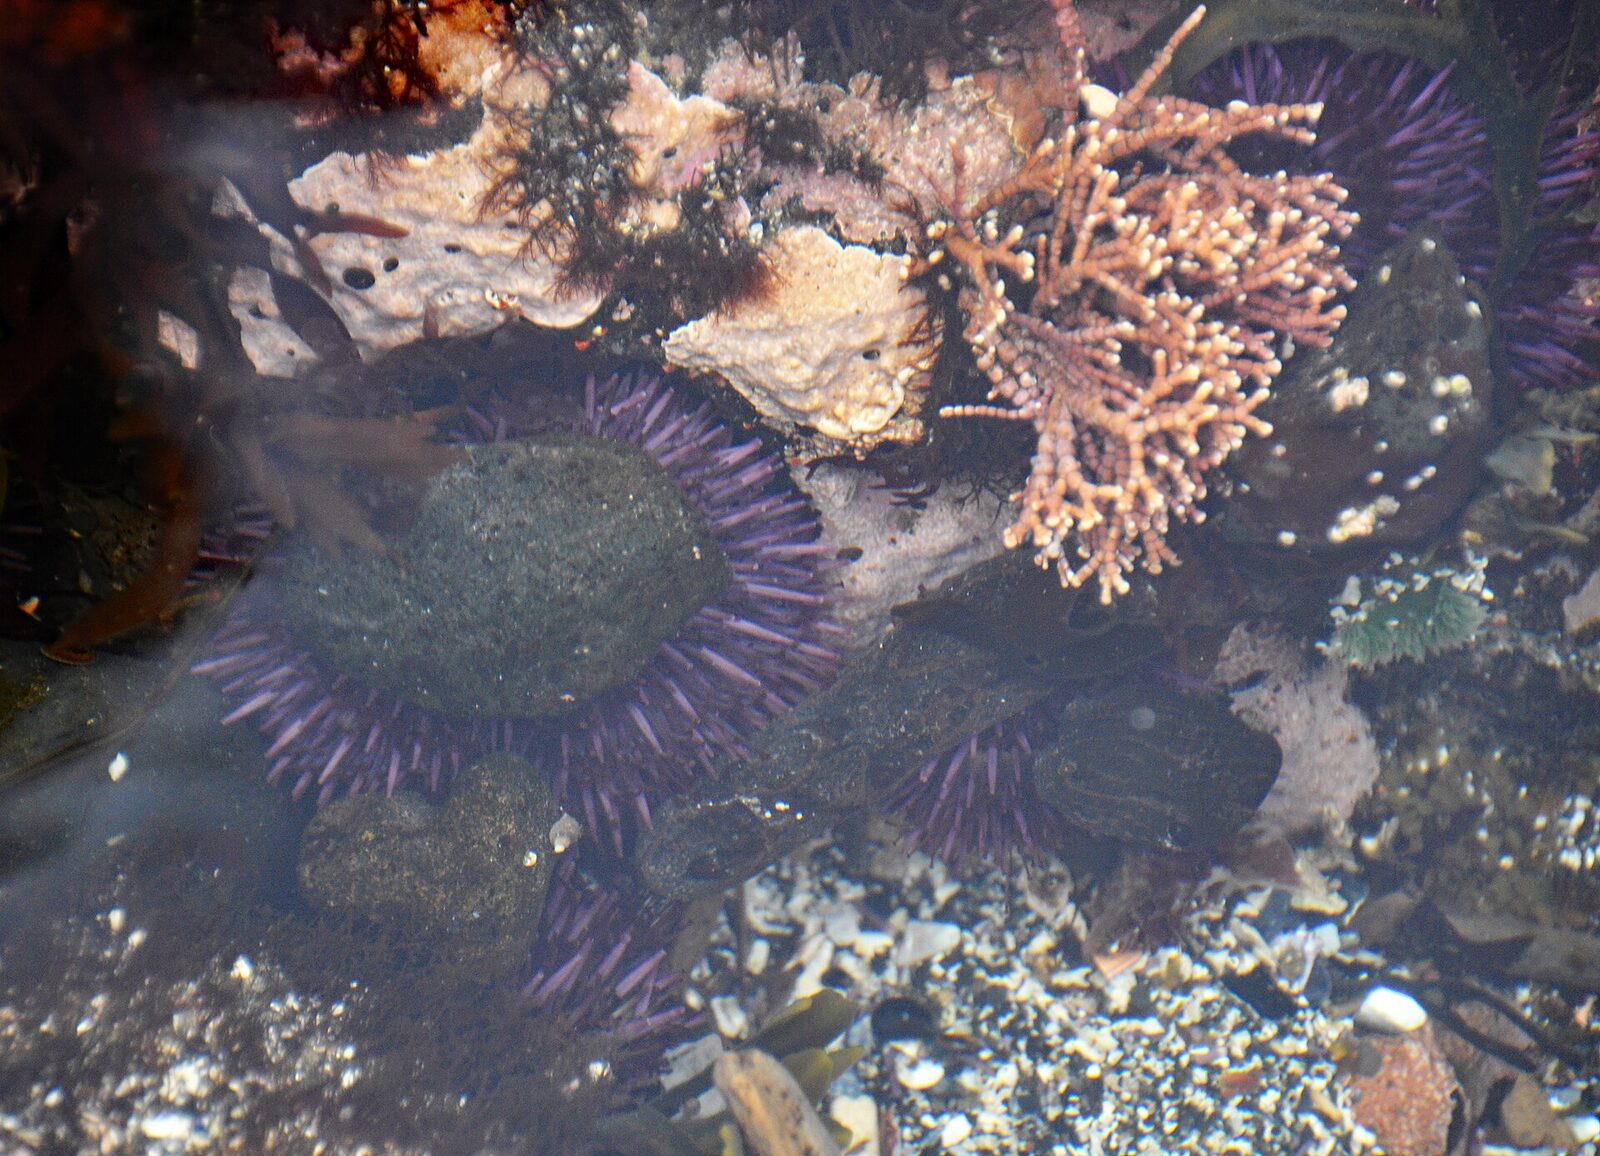
eats
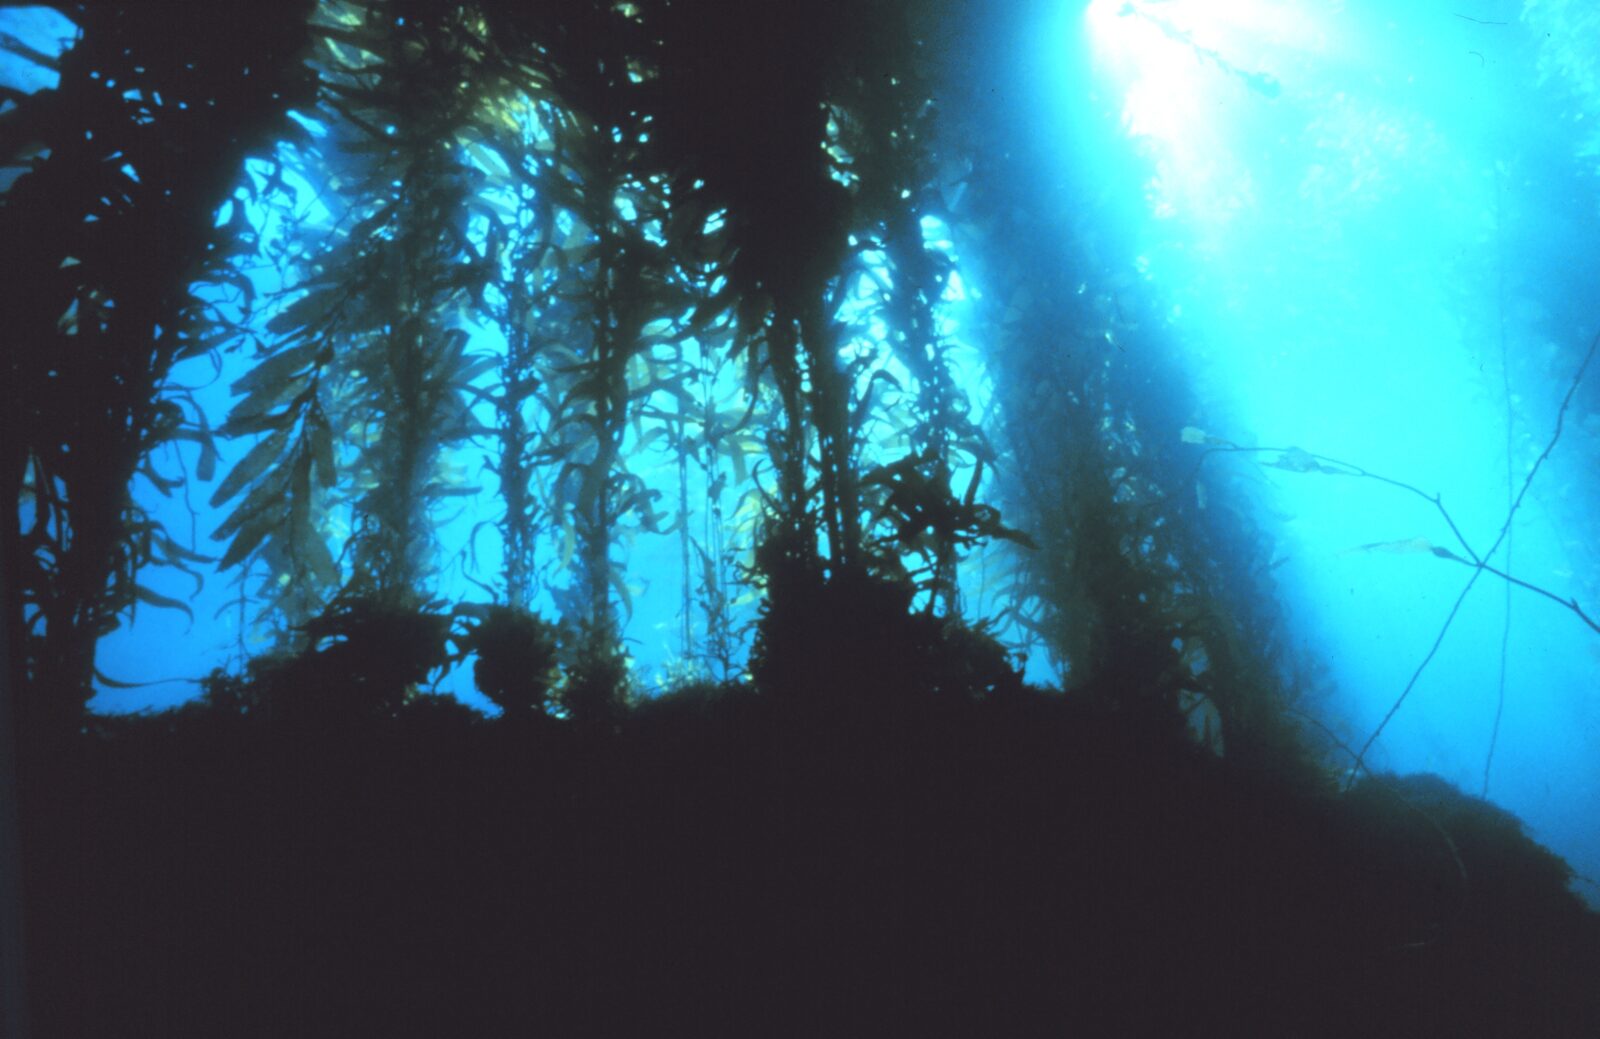
Otters never eat kelp. So why would kelp need otters?
Photos: matt knoth, CC BY 2.0 · James St. John, CC BY 2.0 · NOAA Photo Library
BEFORE YOU START
Two seafloors
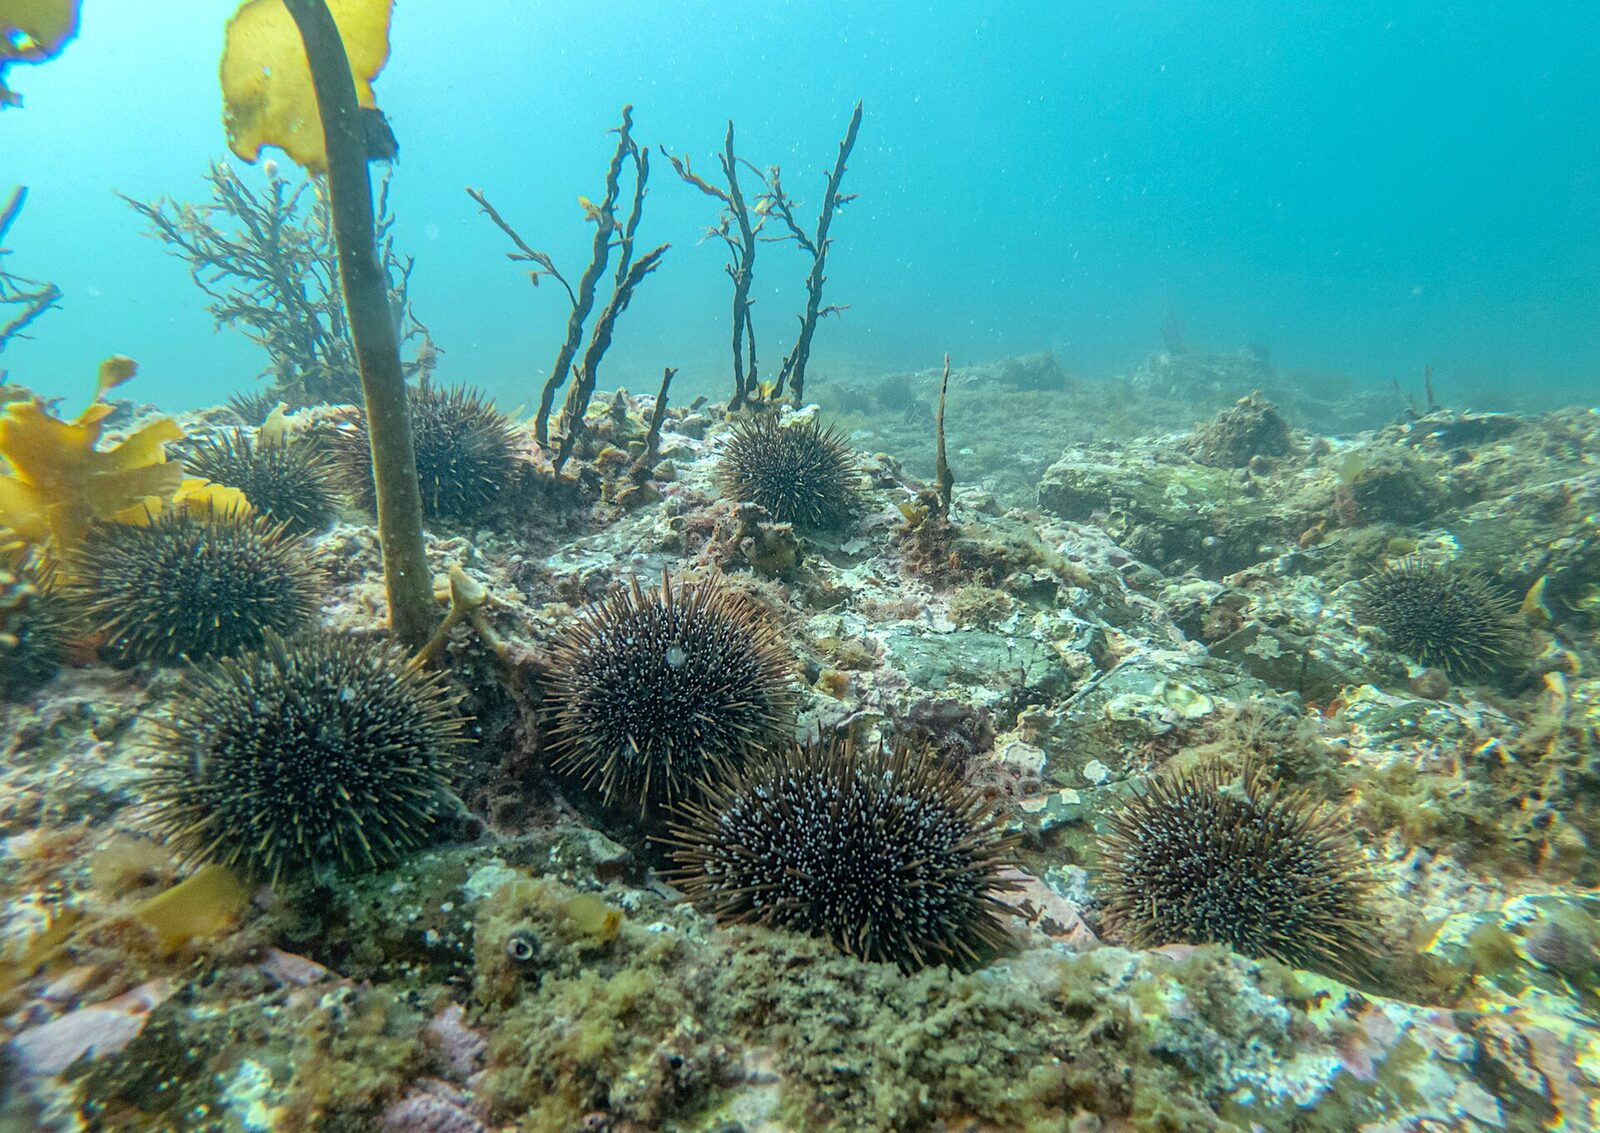
Same kind of rocky reef. Today you find out what makes the difference.
Photos: NOAA Photo Library, Channel Islands · Shaun Lee, CC BY 4.0, New Zealand
BEFORE YOU START
Get set up
1
Open mrsajdak.com/otters on your device.
2
Write your name, the date and your period on the worksheet.
3
Find the three tabs at the top of the lab. Each tab goes with one part of the worksheet.
4
Start on Tab 1. Do not skip ahead.

| Tab in the lab | Worksheet | Questions |
|---|---|---|
| 1. Survey the seafloor | Part 1 | 1 to 5 |
| 2. Keystone coast | Part 2 | 6 to 9 |
| 3. California comeback | Part 3 and Wrap it up | 10 to 16 |
Screenshot: mrsajdak.com/otters
TAB 1 · QUESTIONS 1 TO 5
Part 1. Survey the seafloor
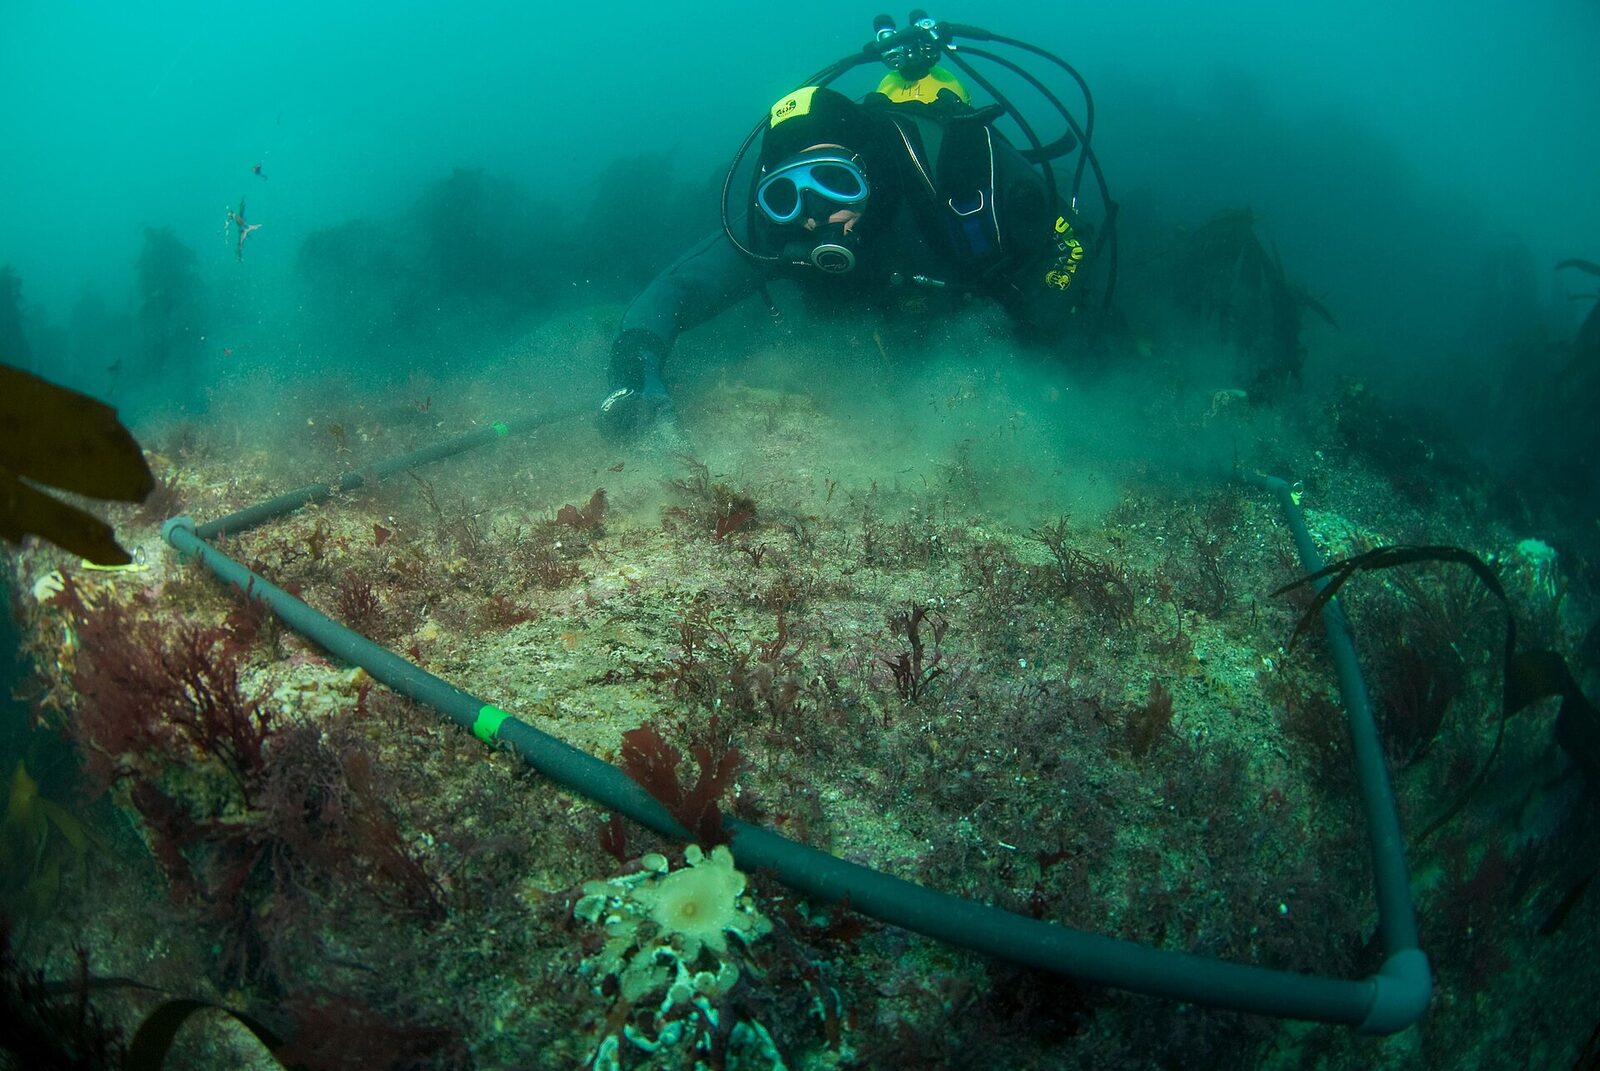
A quadrat is a square frame, 1 m on each side. Divers set it on the seafloor and count what is inside.
You will count 10 quadrats on each of two islands.
Photo: Olivier Dugornay, Ifremer, CC BY 4.0
PART 1 · TAB 1
Count a quadrat
1
Pick Island A. Start with quadrat 1.
2
Tap every purple urchin inside the white square.
3
Tap every kelp plant. Tap the dark knot in the middle. That is its holdfast.
4
Check the tally. Press Record this quadrat.
5
Count two quadrats by hand on each island. Then you may press Count the rest of this island for me.
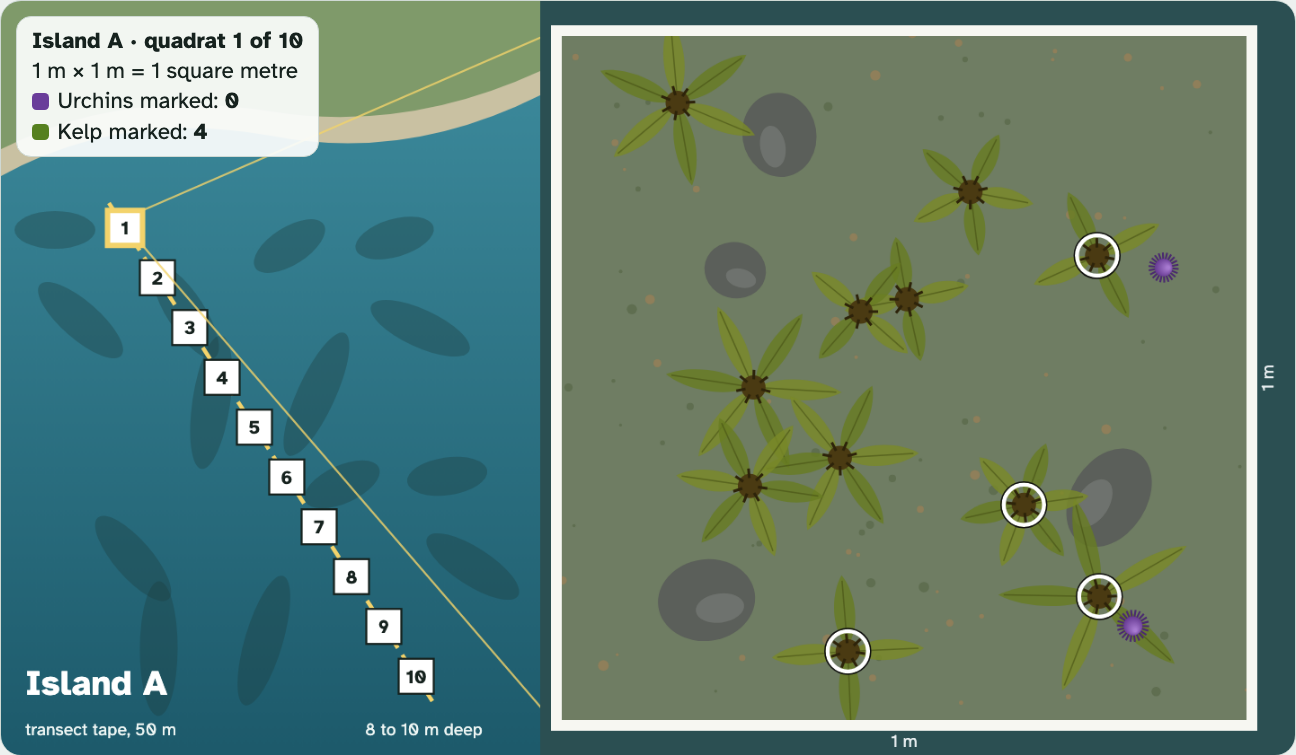
A white ring means you marked it. Tap again to undo. Rocks do not count.
Screenshot: mrsajdak.com/otters, Tab 1
PART 1 · QUESTION 1
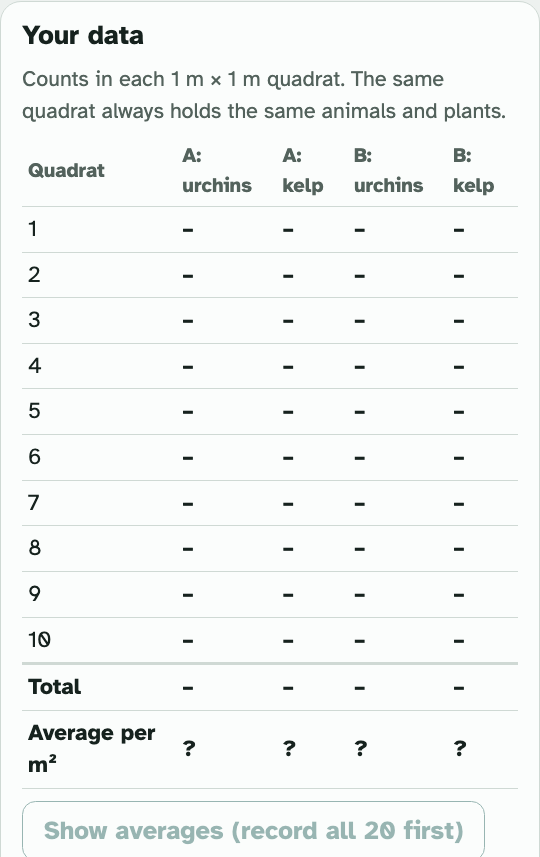
Fill in your data table
1
Find the Your data box in the lab.
2
Copy all 40 counts onto your worksheet.
3
Add up each column. Write the total.
4
Find each average per m². Divide the total by 10.
5
Press Show averages to check your math.
Example
A column adds up to 40 urchins in 10 quadrats.
40 ÷ 10 = 4
That is 4 urchins per m².
These are not your numbers. Use your own totals.
Screenshot: mrsajdak.com/otters, Tab 1
PART 1 · QUESTIONS 2 TO 4
Use your averages
QUESTION 2
B ÷ A
How many times as many?
Take the urchin average for Island B. Divide it by the urchin average for Island A.
Show the division.
QUESTION 3
× 100
Scale it up
A patch of reef is 10 m × 10 m. That is 100 m².
Multiply each urchin average by 100. Do it for both islands.
QUESTION 4
10, not 1
Why so many quadrats?
Look down one column of your table. Are all 10 counts the same?
What if you had counted only one square?
PART 1 · QUESTION 5
Which island has otters?
Claim
Pick one island. Write A or B in the blank.
Evidence
Give two numbers from your table. Say what each number counts.
Reasoning
Explain why those numbers point to otters. Remember what otters eat.
Last, press your answer in Your claim. The lab tells you the real names of both islands. Write them on the last line.
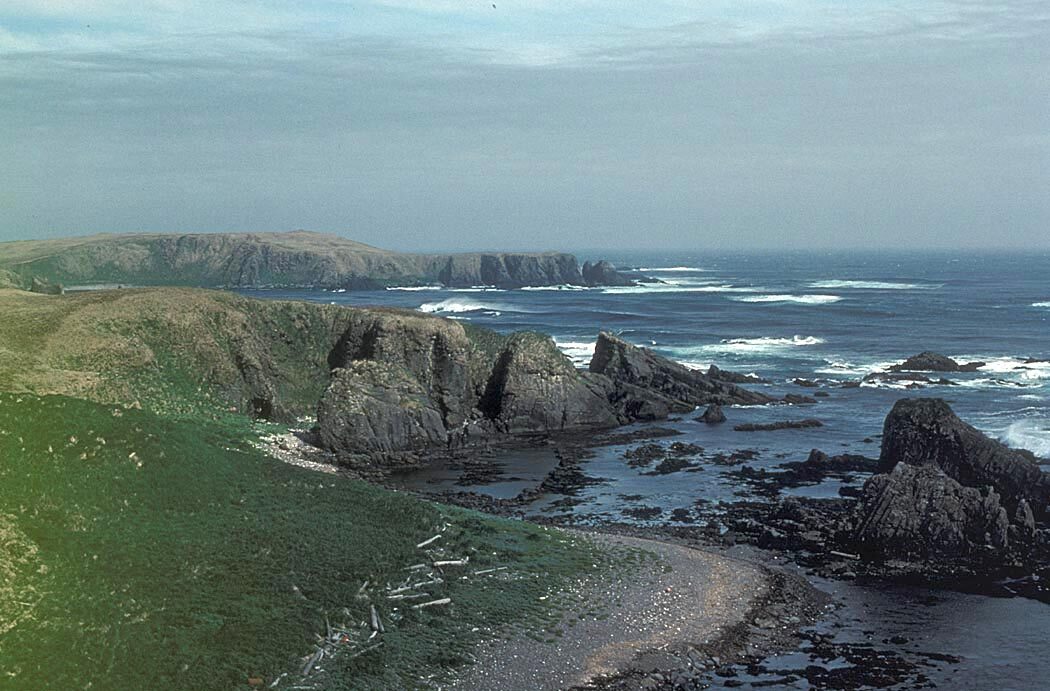
Both islands are in the Aleutian chain of Alaska. Same cold sea, same depth, same rock.
Photo: U.S. Fish and Wildlife Service
TAB 2 · QUESTIONS 6 TO 9
Part 2. Keystone coast
Now you run a model of a whole coast for 50 years.
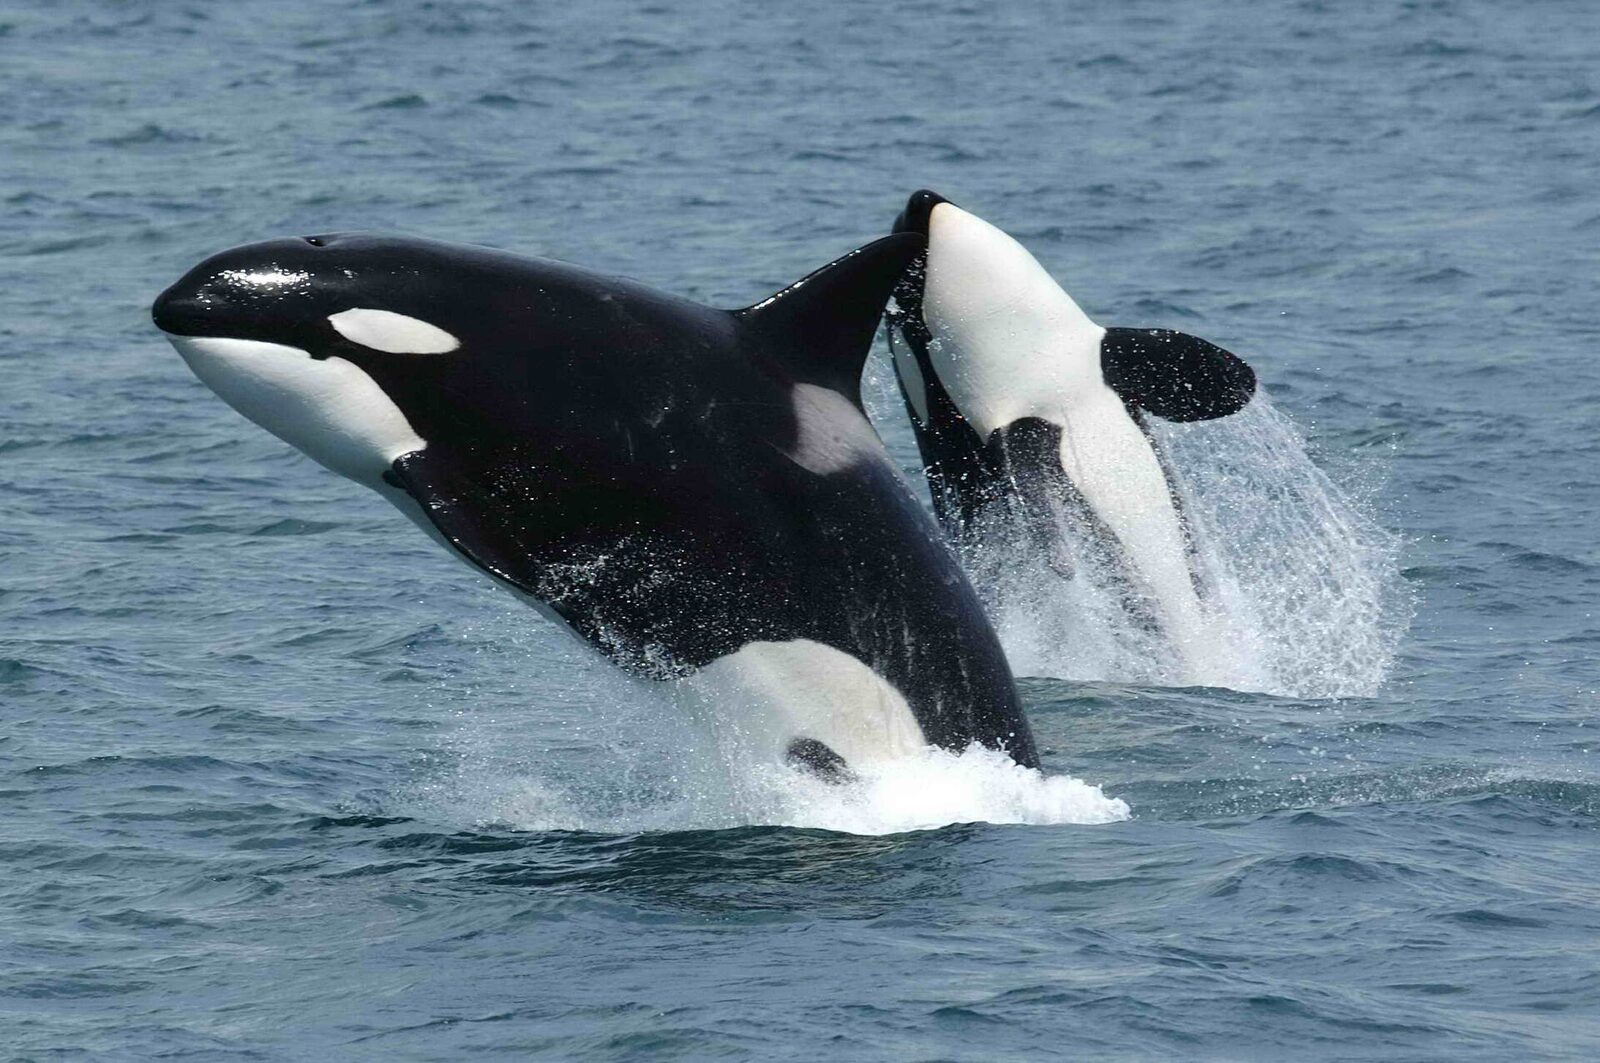
You choose what happens to the otters. Fur hunters. Killer whales. Or otters swimming back in.
Photo: Robert Pittman, NOAA
PART 2 · TAB 2
Predict, then run
1
In On this coast, check the boxes for your run. Uncheck everything else.
2
In Predict first, pick what urchins and kelp will do by year 50.
3
Draw the same arrows on your worksheet. Up, down, or = for the same.
4
Press Run. Or press Skip to the end.
5
Find Your runs. Copy the three numbers at year 50.
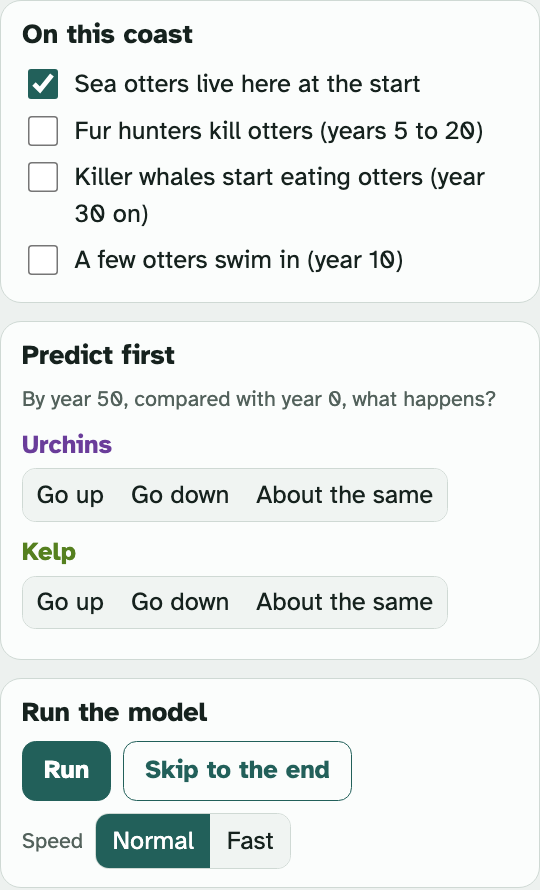
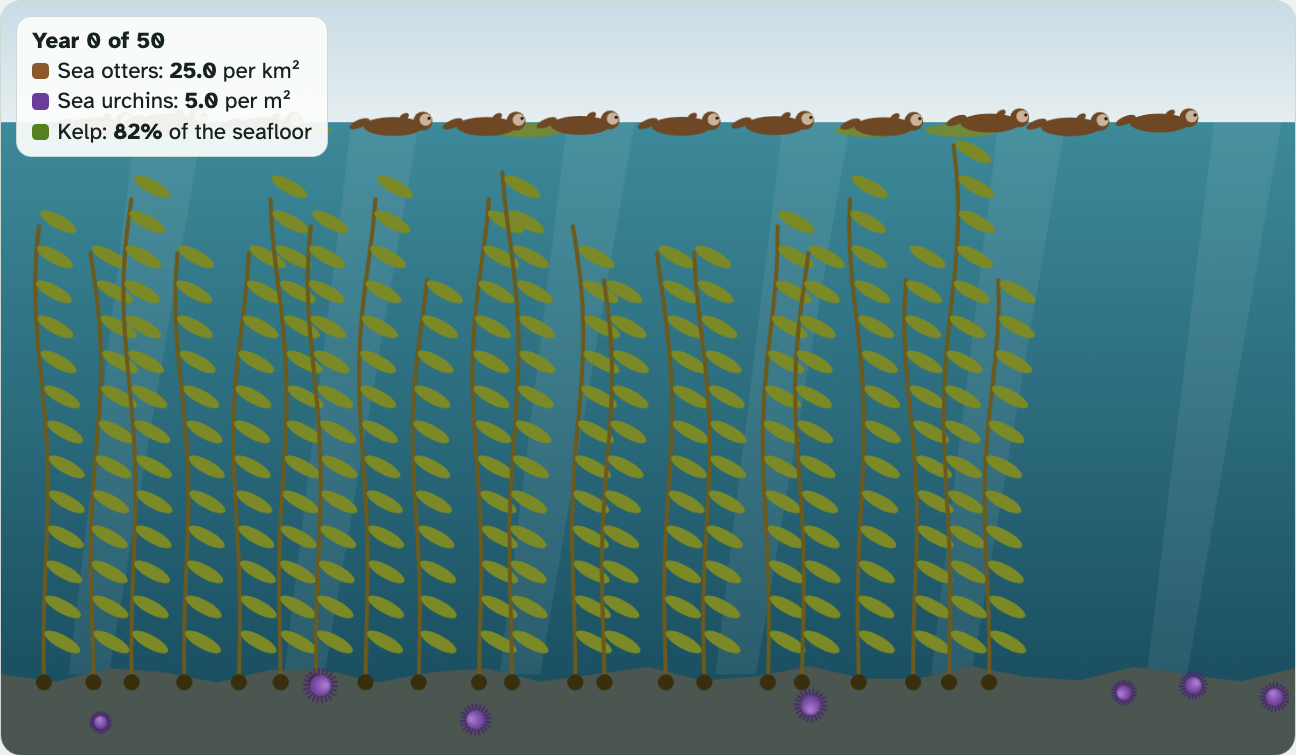
The picture shows the coast. The box in its corner shows the year and the numbers.
A wrong prediction is fine. Make it before you run.
Screenshots: mrsajdak.com/otters, Tab 2
PART 2 · QUESTION 6
Your four runs
| Run | Row on your worksheet | Boxes to check in the lab |
|---|---|---|
| 1 | Otters at the start (nothing else) | Sea otters live here at the start |
| 2 | Otters at the start + killer whales | Sea otters live here at the start, and Killer whales start eating otters |
| 3 | Otters at the start + fur hunters | Sea otters live here at the start, and Fur hunters kill otters |
| 4 | No otters at the start + a few swim in | A few otters swim in. Uncheck Sea otters live here at the start. |
For every run: predict, run, then write otters per km², urchins per m² and kelp % at year 50.
PART 2 · QUESTIONS 7 TO 9
Explain what you saw
QUESTION 7
Fill the chain
Look at your killer whale run.
Write up or down in each box: otters, then urchins, then kelp.
QUESTION 8
Keystone species
A keystone species has a much bigger effect than its numbers suggest.
Pick two numbers from your table. Use one run with otters and one run without them.
QUESTION 9
Is the kelp back?
Look at your fur hunter run at year 50.
Compare the otter number with the kelp %. What does that tell you about how fast a kelp forest comes back?
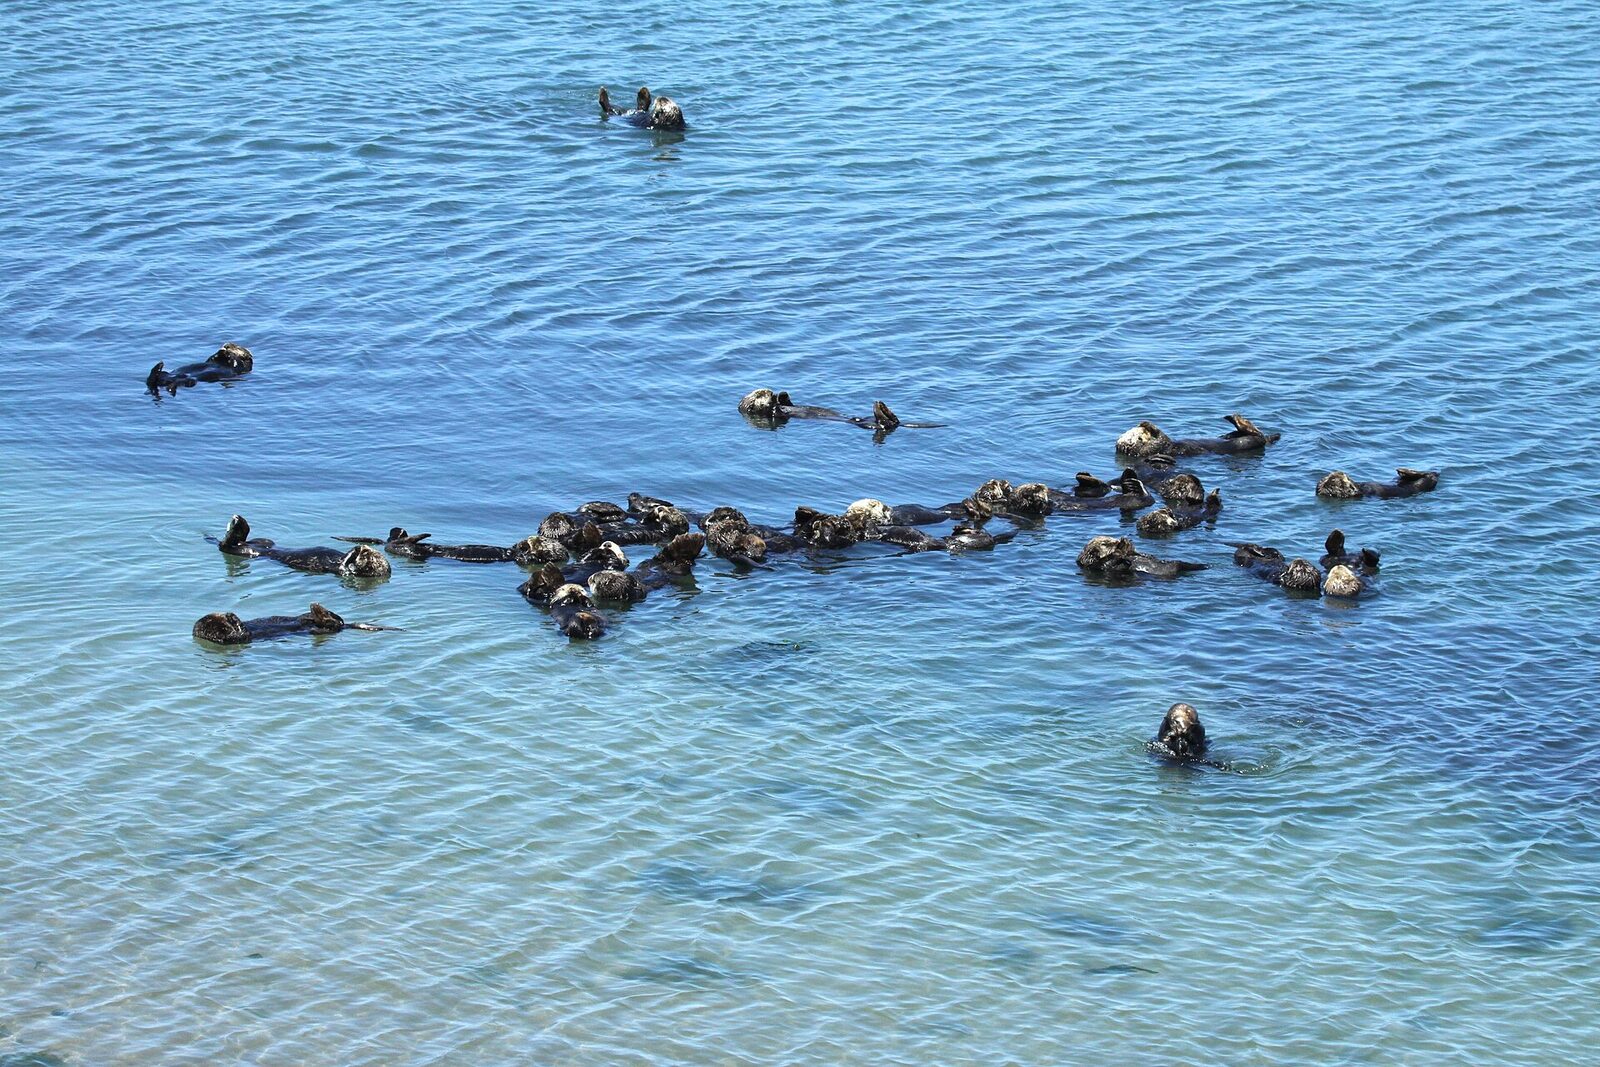
A change at the top of a food chain that passes down, level by level, is called a trophic cascade.
TAB 3 · QUESTIONS 10 TO 14
Part 3. California comeback
In 1938 about 50 sea otters were left in California.
Scientists have counted them every spring since 1982. You will test what holds them back today.
Photo: U.S. Fish and Wildlife Service, Pacific Southwest Region
PART 3 · QUESTION 10
Read the graph
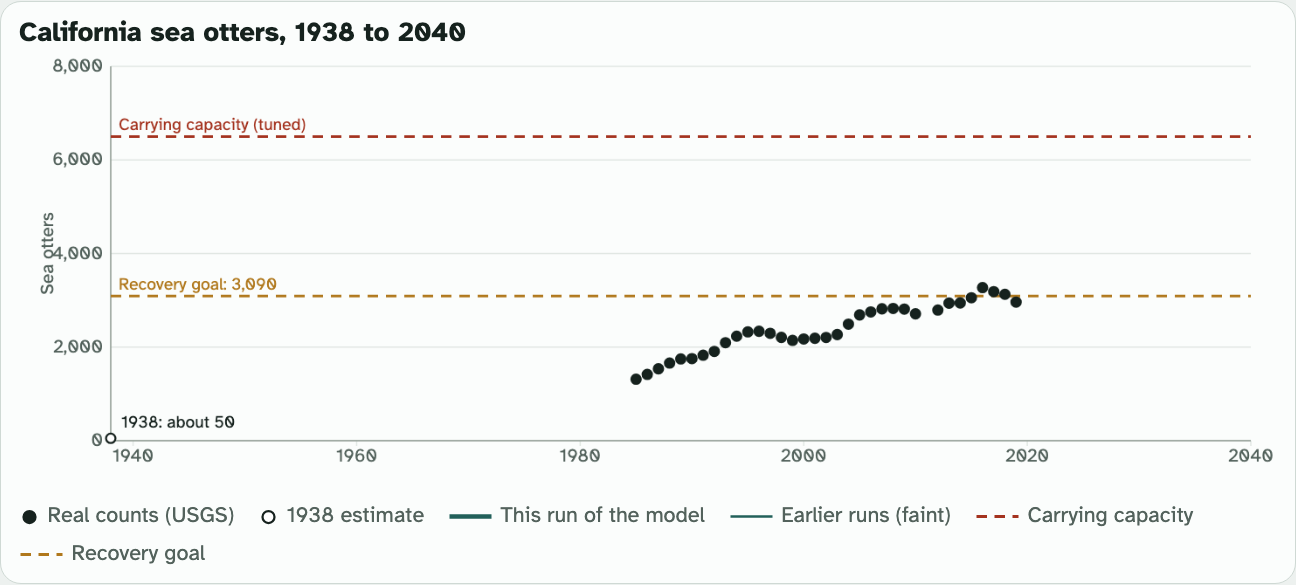
Black dots: the real count each spring.
Red dashed line: the carrying capacity. It is the most otters this coast could hold.
Gold dashed line: the recovery goal.
For question 10
Find four counts: 1938, 1985, the highest year, and 2019.
Tip: press Run and watch the box on the map. It shows the real count for each year.
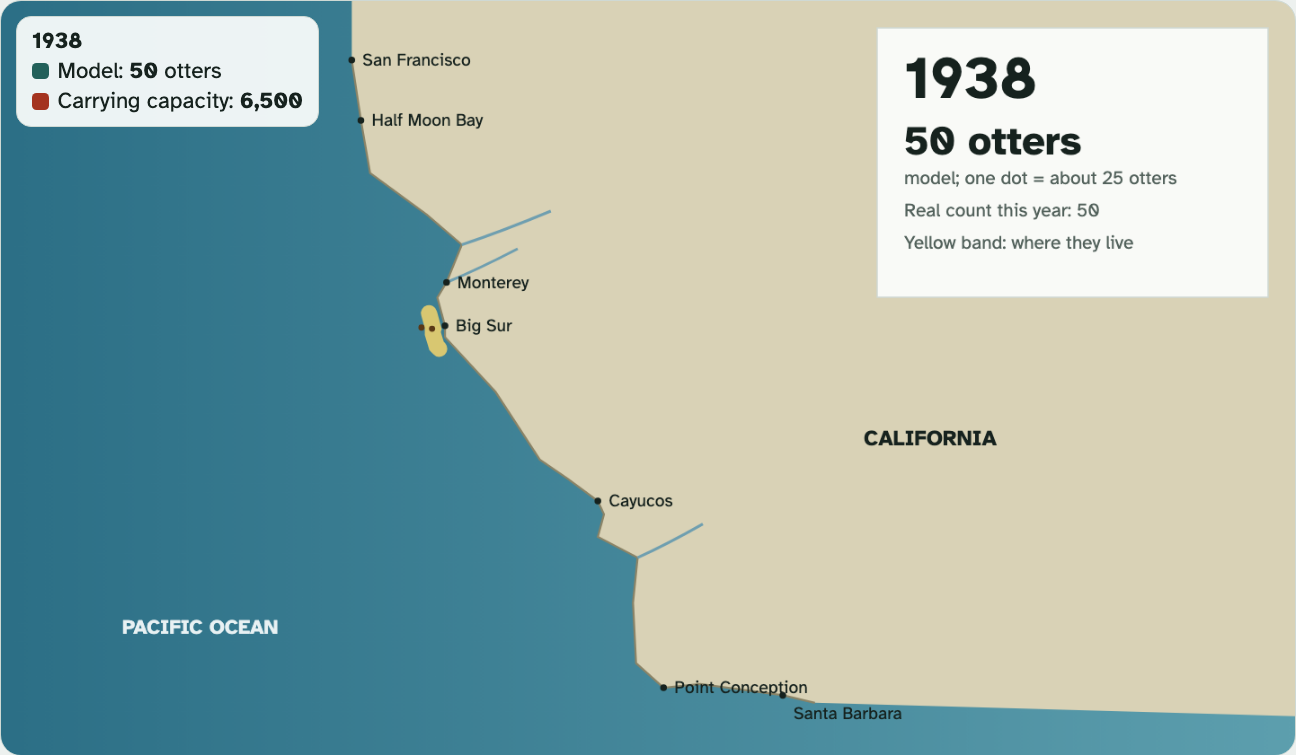
The map shows where the otters live. The yellow band grows as the model runs.
Screenshots: mrsajdak.com/otters, Tab 3 · Counts: U.S. Geological Survey
PART 3 · QUESTION 11
Make the model fit the dots
1
Keep the growth rate at 10%.
2
Leave Range can spread unchecked.
3
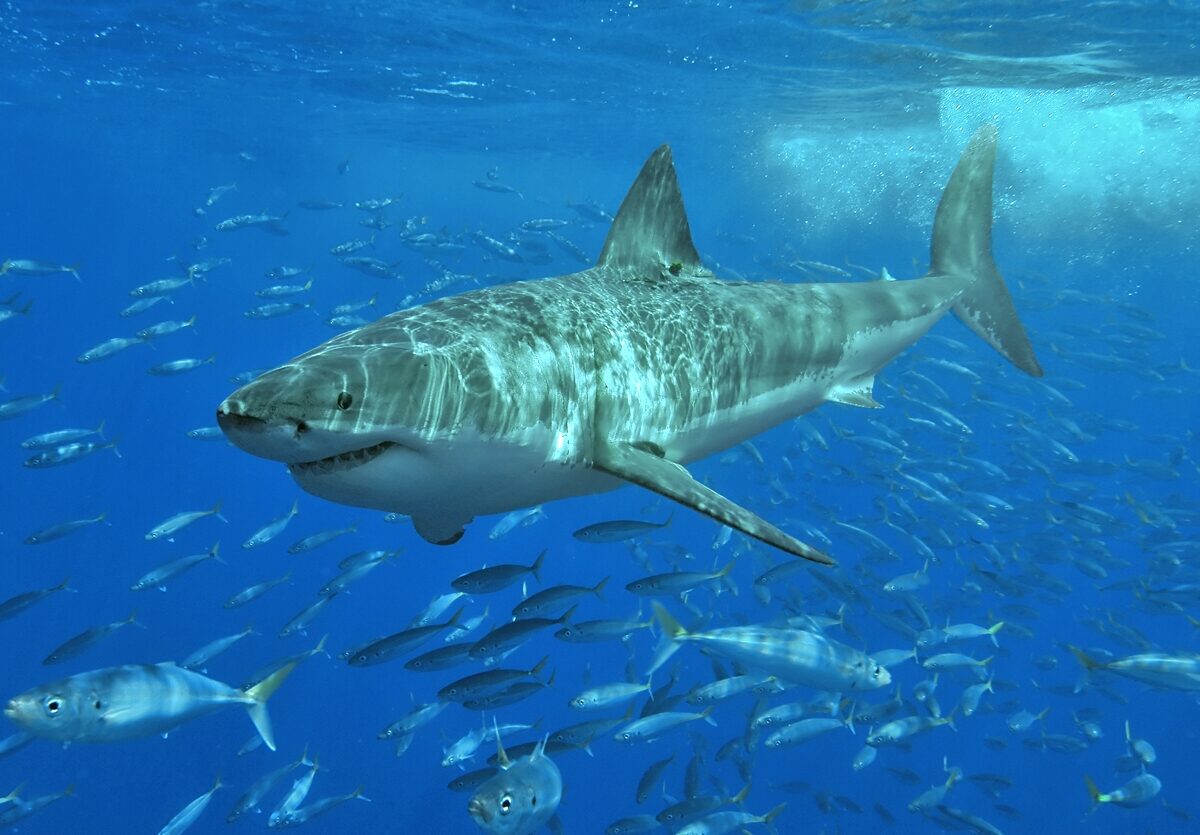
Check the boxes for your row: none, disease, shark bites, or both.
4
Press Skip to the end.
5
In Your runs, copy 2019, 2040 and Average miss.
6
Last row: try settings of your own.
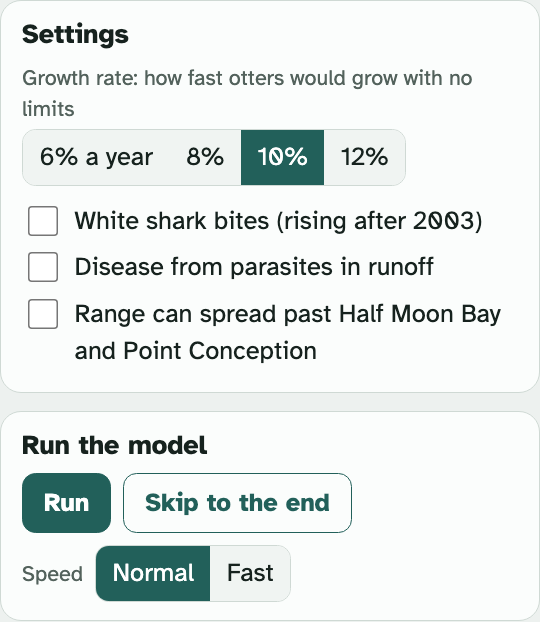
Average miss is how far the model is from the real dots. Smaller is a better fit.
Screenshot: mrsajdak.com/otters, Tab 3 · Photo: Terry Goss, CC BY 2.5
PART 3 · QUESTIONS 12 TO 14
What holds the otters back?
QUESTION 12
Best fit
Smallest miss wins
Find the row with the smallest Average miss. Name its settings. Give the number as your proof.
QUESTION 13
6,500
The carrying capacity
Where does your best model level off? Write that number. Then name the cause and its effect.
QUESTION 14
3,090
The recovery goal
Does your best fit reach the goal and stay there by 2040? What would have to change?
WRAP IT UP · QUESTIONS 15 AND 16
Ask a question. Argue with numbers.
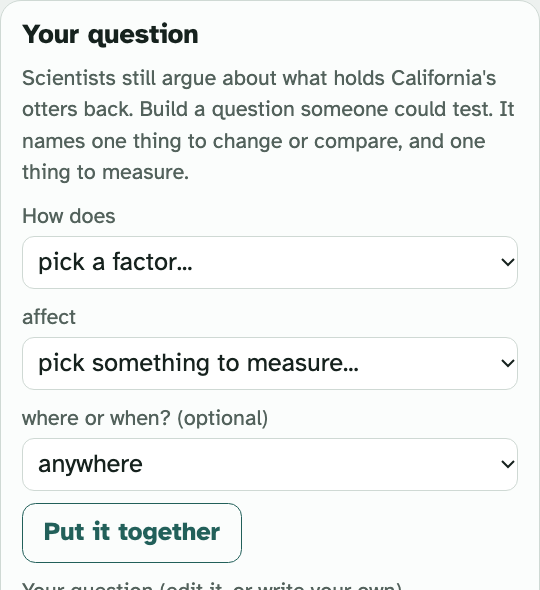
QUESTION 15
Build a question you could test
In Your question, pick a factor. Pick something to measure. Press Put it together, then Save my question.
Copy it to your worksheet. It must name one thing to change or compare and one thing to measure.
QUESTION 16
"The coast is full." Is it?
Agree or disagree with the classmate. Use at least two numbers from Part 3 as your evidence.
Screenshot: mrsajdak.com/otters, Tab 3
LAST CHECK
Before you hand it in
Name, date and period are on top.
All three tables are full.
Every math answer shows the work.
Every claim uses numbers from your own tables.
Photo: matt knoth, CC BY 2.0