ENVIRONMENTAL SCIENCE · CHAPTER 5
Population Limits Lab
Follow along with your worksheet, one question at a time.
mrsajdak.com/populations
Photo: NOAA Central Library
BEFORE YOU START
Nothing grows forever
The four cases
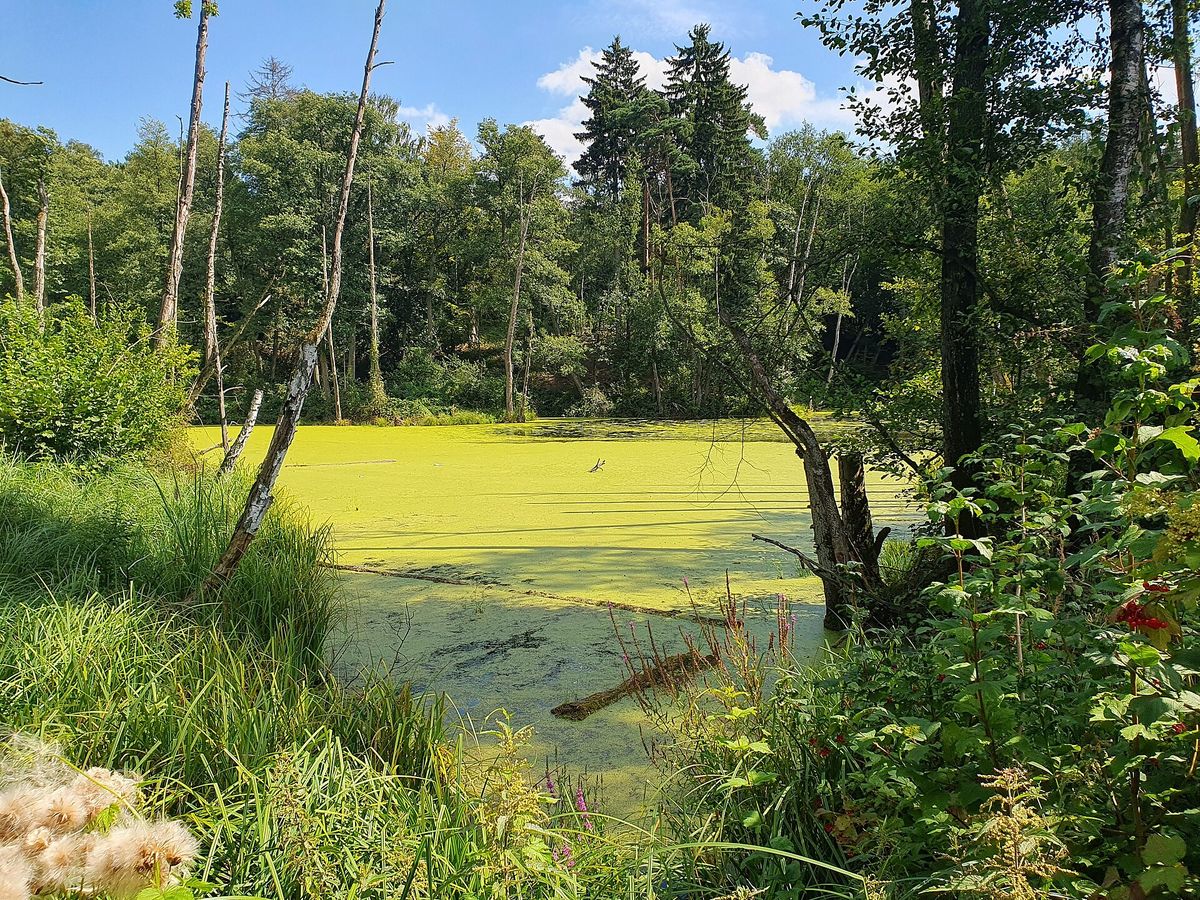
1. Duckweed on a pond
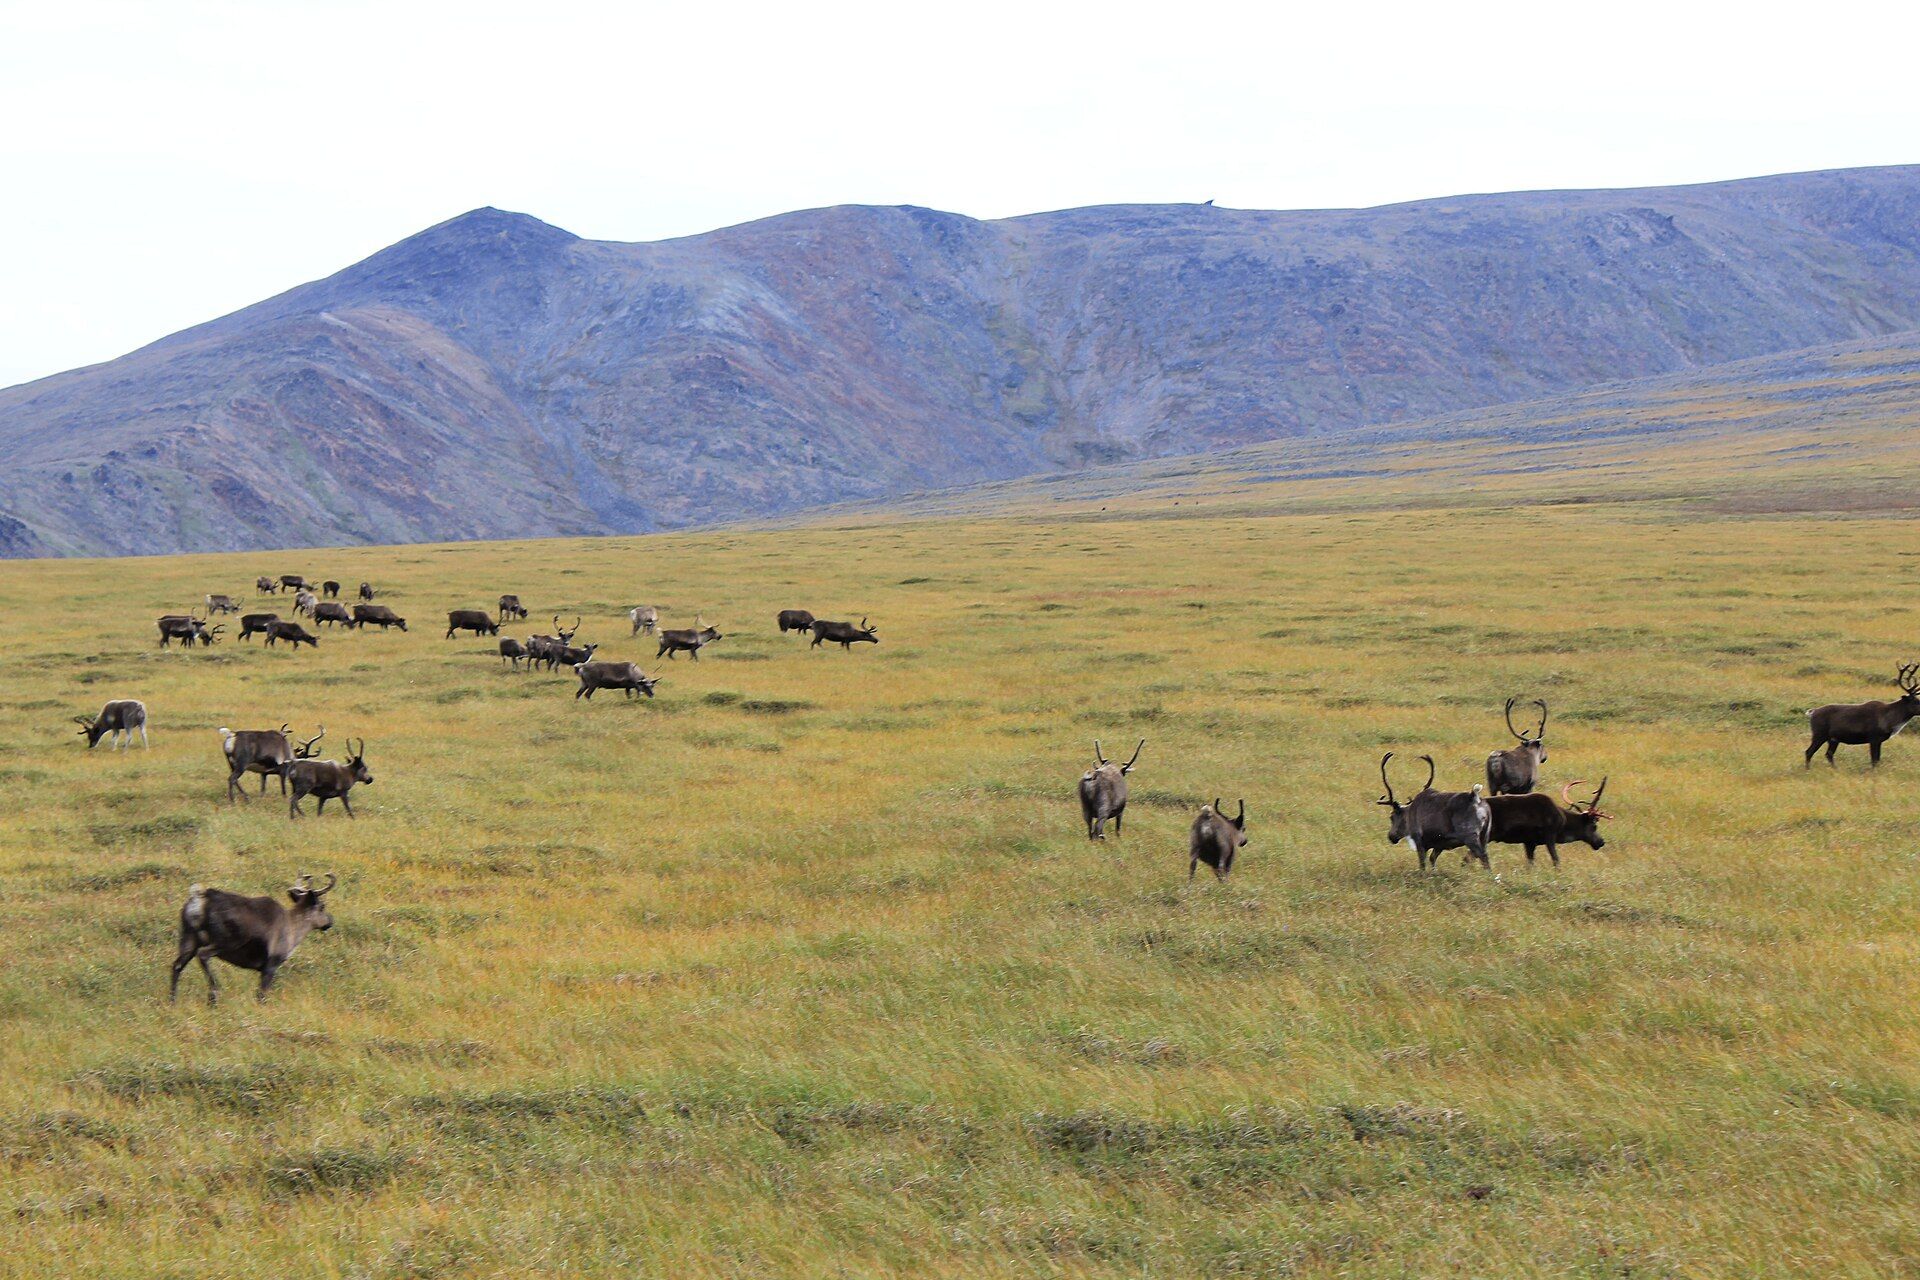
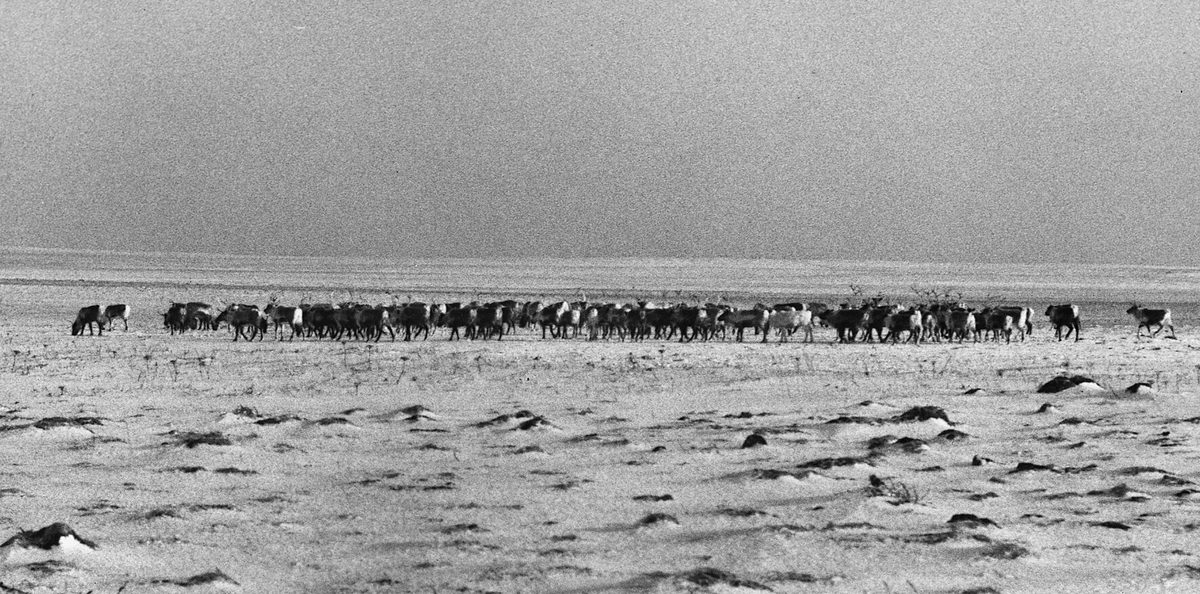
2. Reindeer on an island
3. Trout in tanks
4. Bears, robins and perch
A limiting factor is anything that keeps a population from growing bigger.
Every population can grow fast. So what holds each one back?
Photos: Paavo01, CC BY 4.0 · U.S. National Archives
BEFORE YOU START
Get set up
1
Open mrsajdak.com/populations on your device.
2
Write your name, the date and your period on the worksheet.
3
Find the four tabs at the top of the lab. Each tab goes with one part of the worksheet.
4
Start on Tab 1. Do not skip ahead.

| Tab in the lab | Worksheet | Questions |
|---|---|---|
| 1. Duckweed pond | Part 1 | 1 to 4 |
| 2. Reindeer island | Part 2 | 5 to 9 |
| 3. Trout tanks | Part 3 | 10 to 13 |
| 4. Life strategies | Part 4 and Wrap it up | 14 to 16 |
Screenshot: mrsajdak.com/populations
TAB 1 · QUESTIONS 1 TO 4
Part 1. Duckweed pond
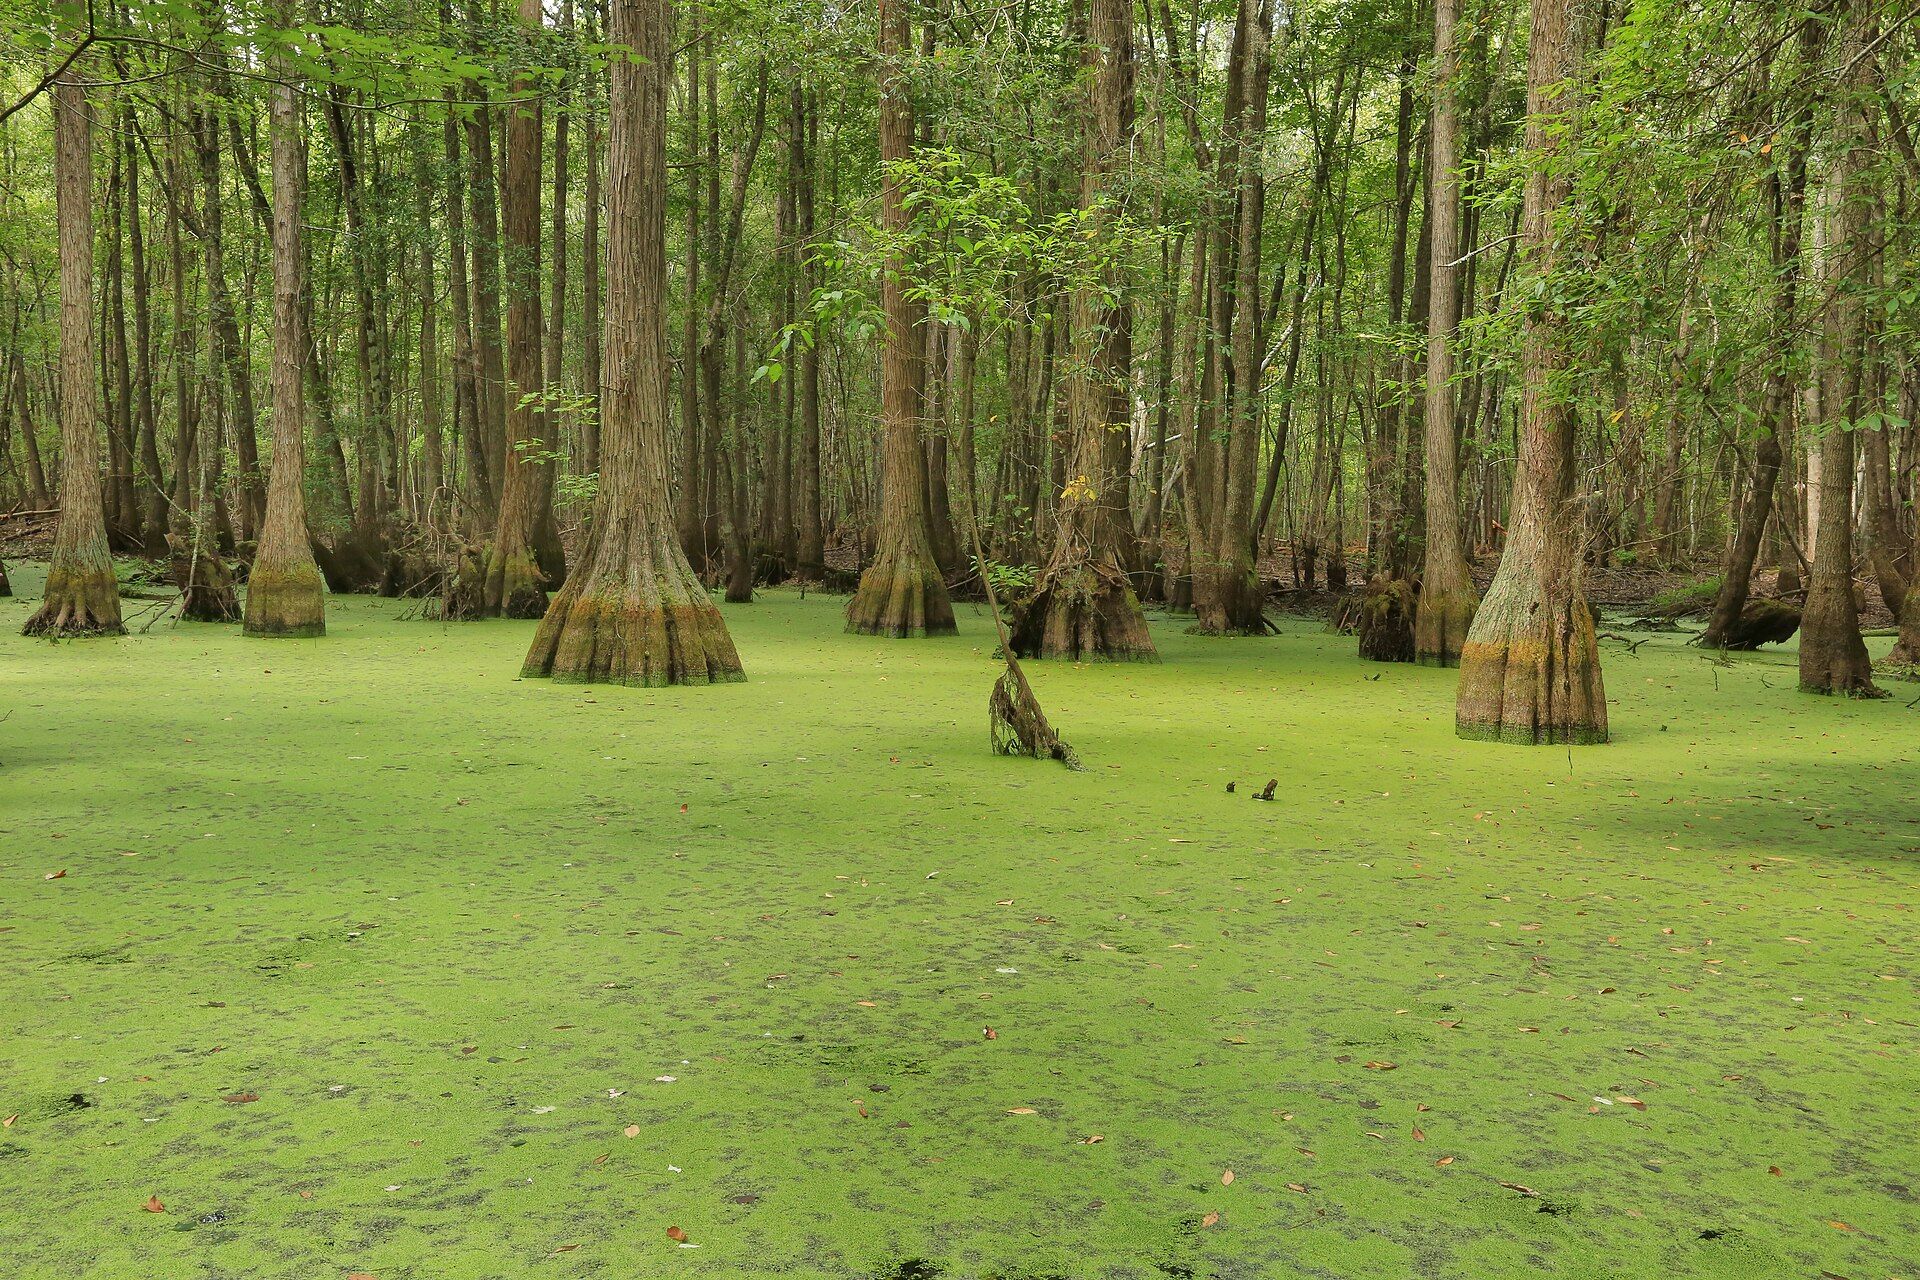
Duckweed is a tiny floating plant. Each plant splits into a new one about every 2 days.
You will grow it on a pond four ways. Find out what stops it.
Photo: U.S. Geological Survey
PART 1 · TAB 1
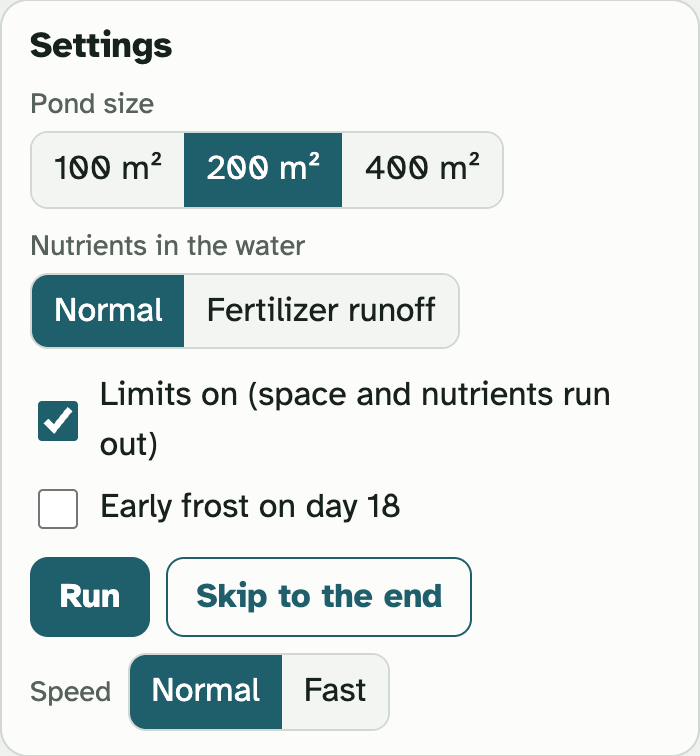
Set the pond, then run it
1
Find the Settings box. Pick a Pond size. Pick the Nutrients in the water.
2
Check or uncheck Limits on.
3
Press Skip to the end. Or press Run to watch all 30 days.
4
Find Your runs. It keeps the numbers for every setting you try.
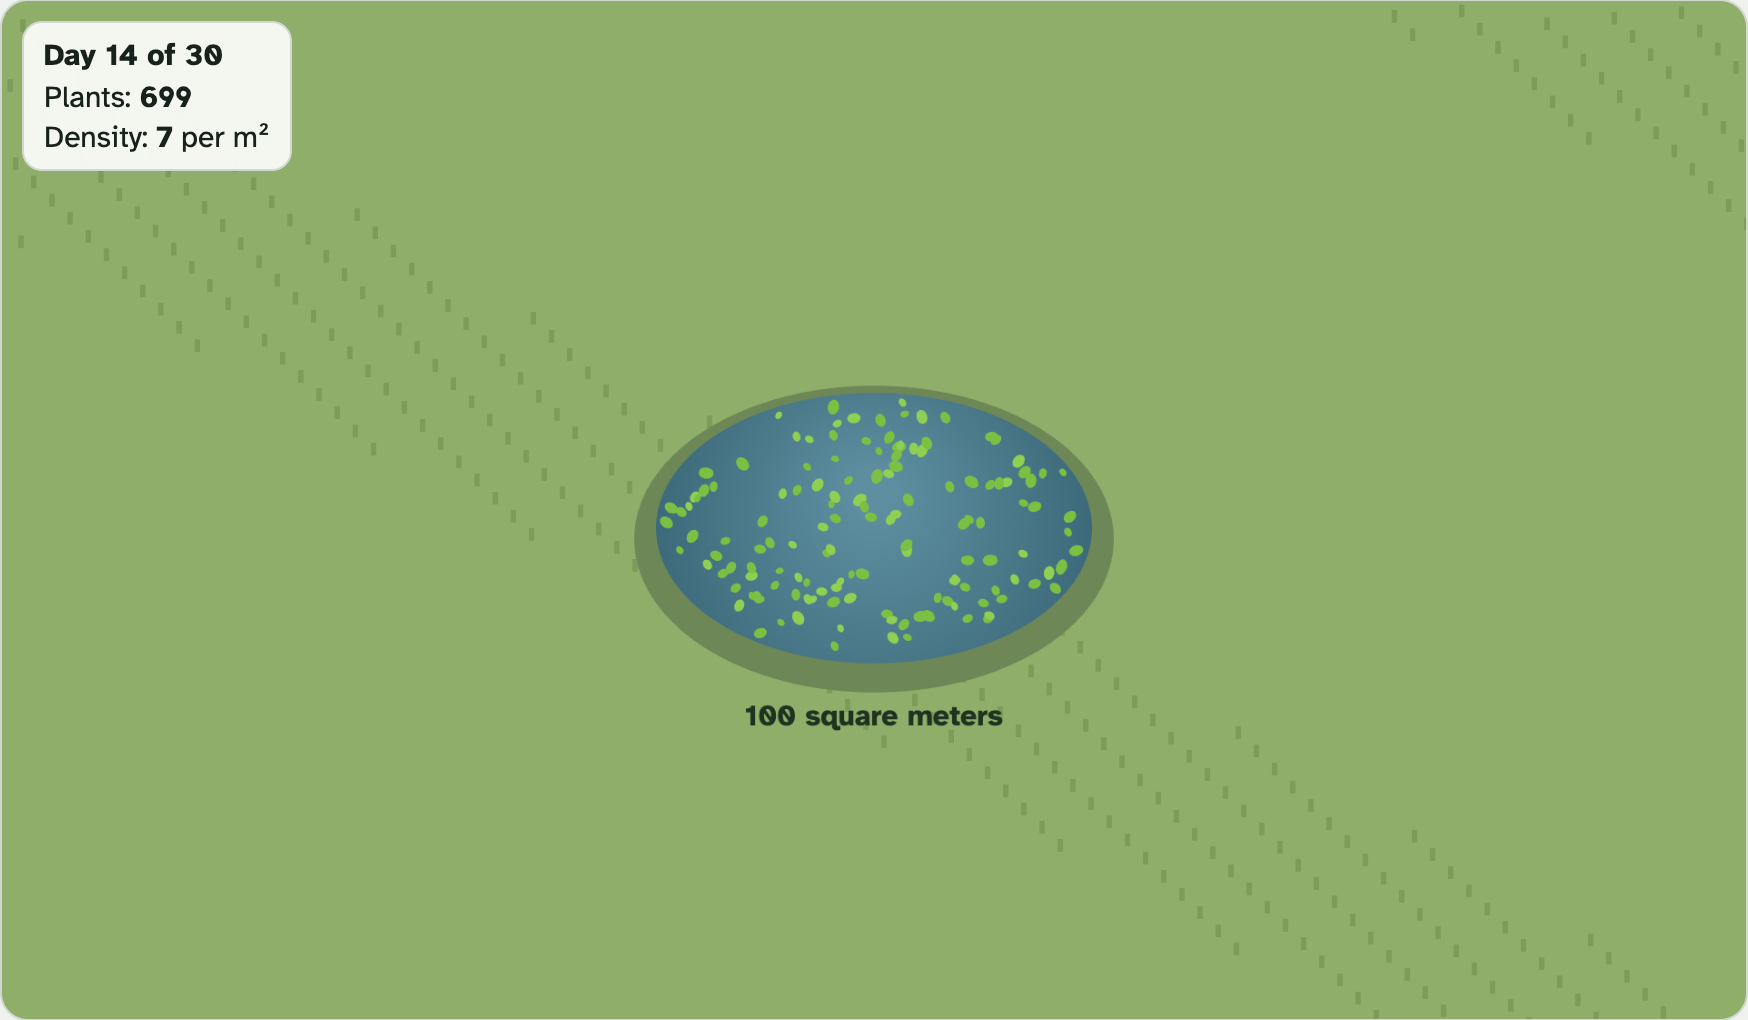
Each dot on the pond stands for 5 plants.
The box in the corner shows the day, the plants and the density.
Change a setting and the run starts over.
Screenshots: mrsajdak.com/populations, Tab 1
PART 1 · QUESTION 1
Your four runs
| Run | Limits | Pond size | Nutrients |
|---|---|---|---|
| 1 | OFF | 200 m² | Normal |
| 2 | on | 200 m² | Normal |
| 3 | on | 400 m² | Normal |
| 4 | on | 200 m² | Fertilizer runoff |
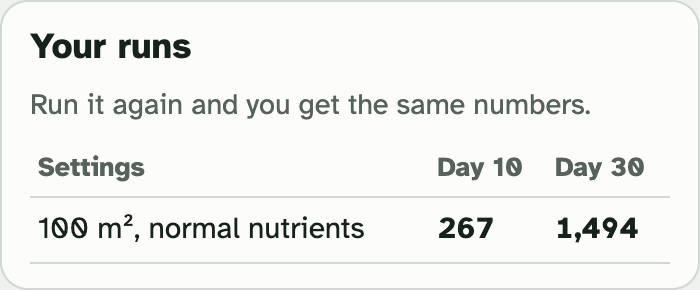
Copy Day 10 and Day 30 for each run.
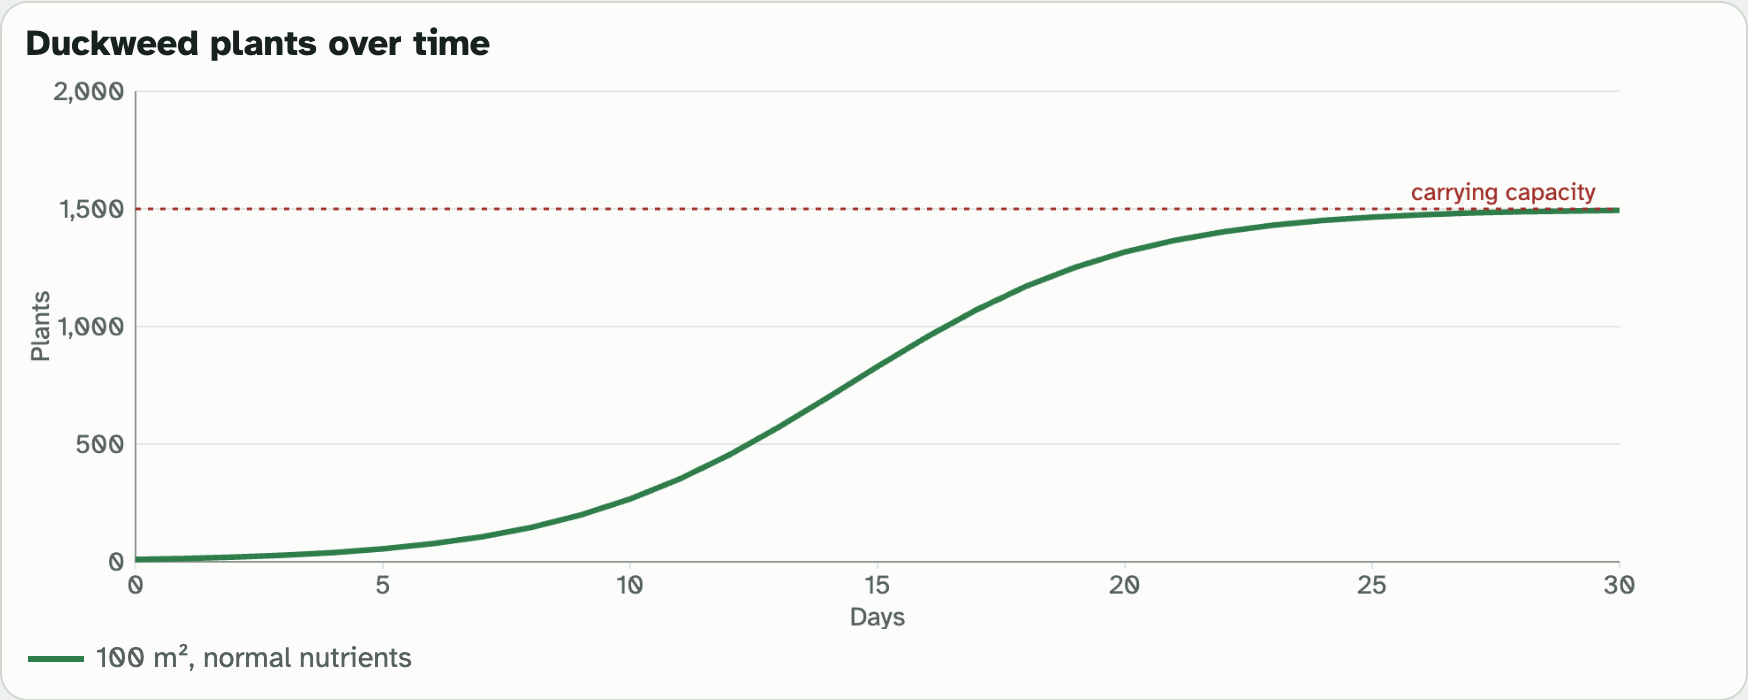
J or S? Look at the line on the graph. A J-curve keeps shooting up. An S-curve climbs, then levels off.
Screenshot: mrsajdak.com/populations, Tab 1
PART 1 · QUESTION 2
Where does it level off?
1
Run limits on, 200 m², Normal again. Look at the graph.
2
Find the dotted red line. The plants level off near it. Read its number on the left side.
3
The graph names the dotted line. That name is the second blank.
4
For population density, divide the plants on day 30 by the size of the pond.
Example
1,000 ÷ 50 = 20
A pond with 1,000 plants on 50 m² has 20 plants per m². Not your numbers.
Screenshot: mrsajdak.com/populations, Tab 1
PART 1 · QUESTIONS 3 AND 4
What held the duckweed back?
QUESTION 3
2
Two limiting factors
A bigger pond raised the top number. So did fertilizer runoff.
What did each one give the plants more of? Name both.
QUESTION 4
6 in 10
An early frost
Check Early frost on day 18. Run it. Watch the line on day 18.
Frost kills 6 of every 10 plants. Does it matter how crowded the pond is?
Two kinds of limits
Density-dependent: it hits harder when the population is crowded.
Density-independent: it hits the same, crowded or not.
Pick one for frost. Say how you know.
TAB 2 · QUESTIONS 5 TO 9
Part 2. Reindeer island
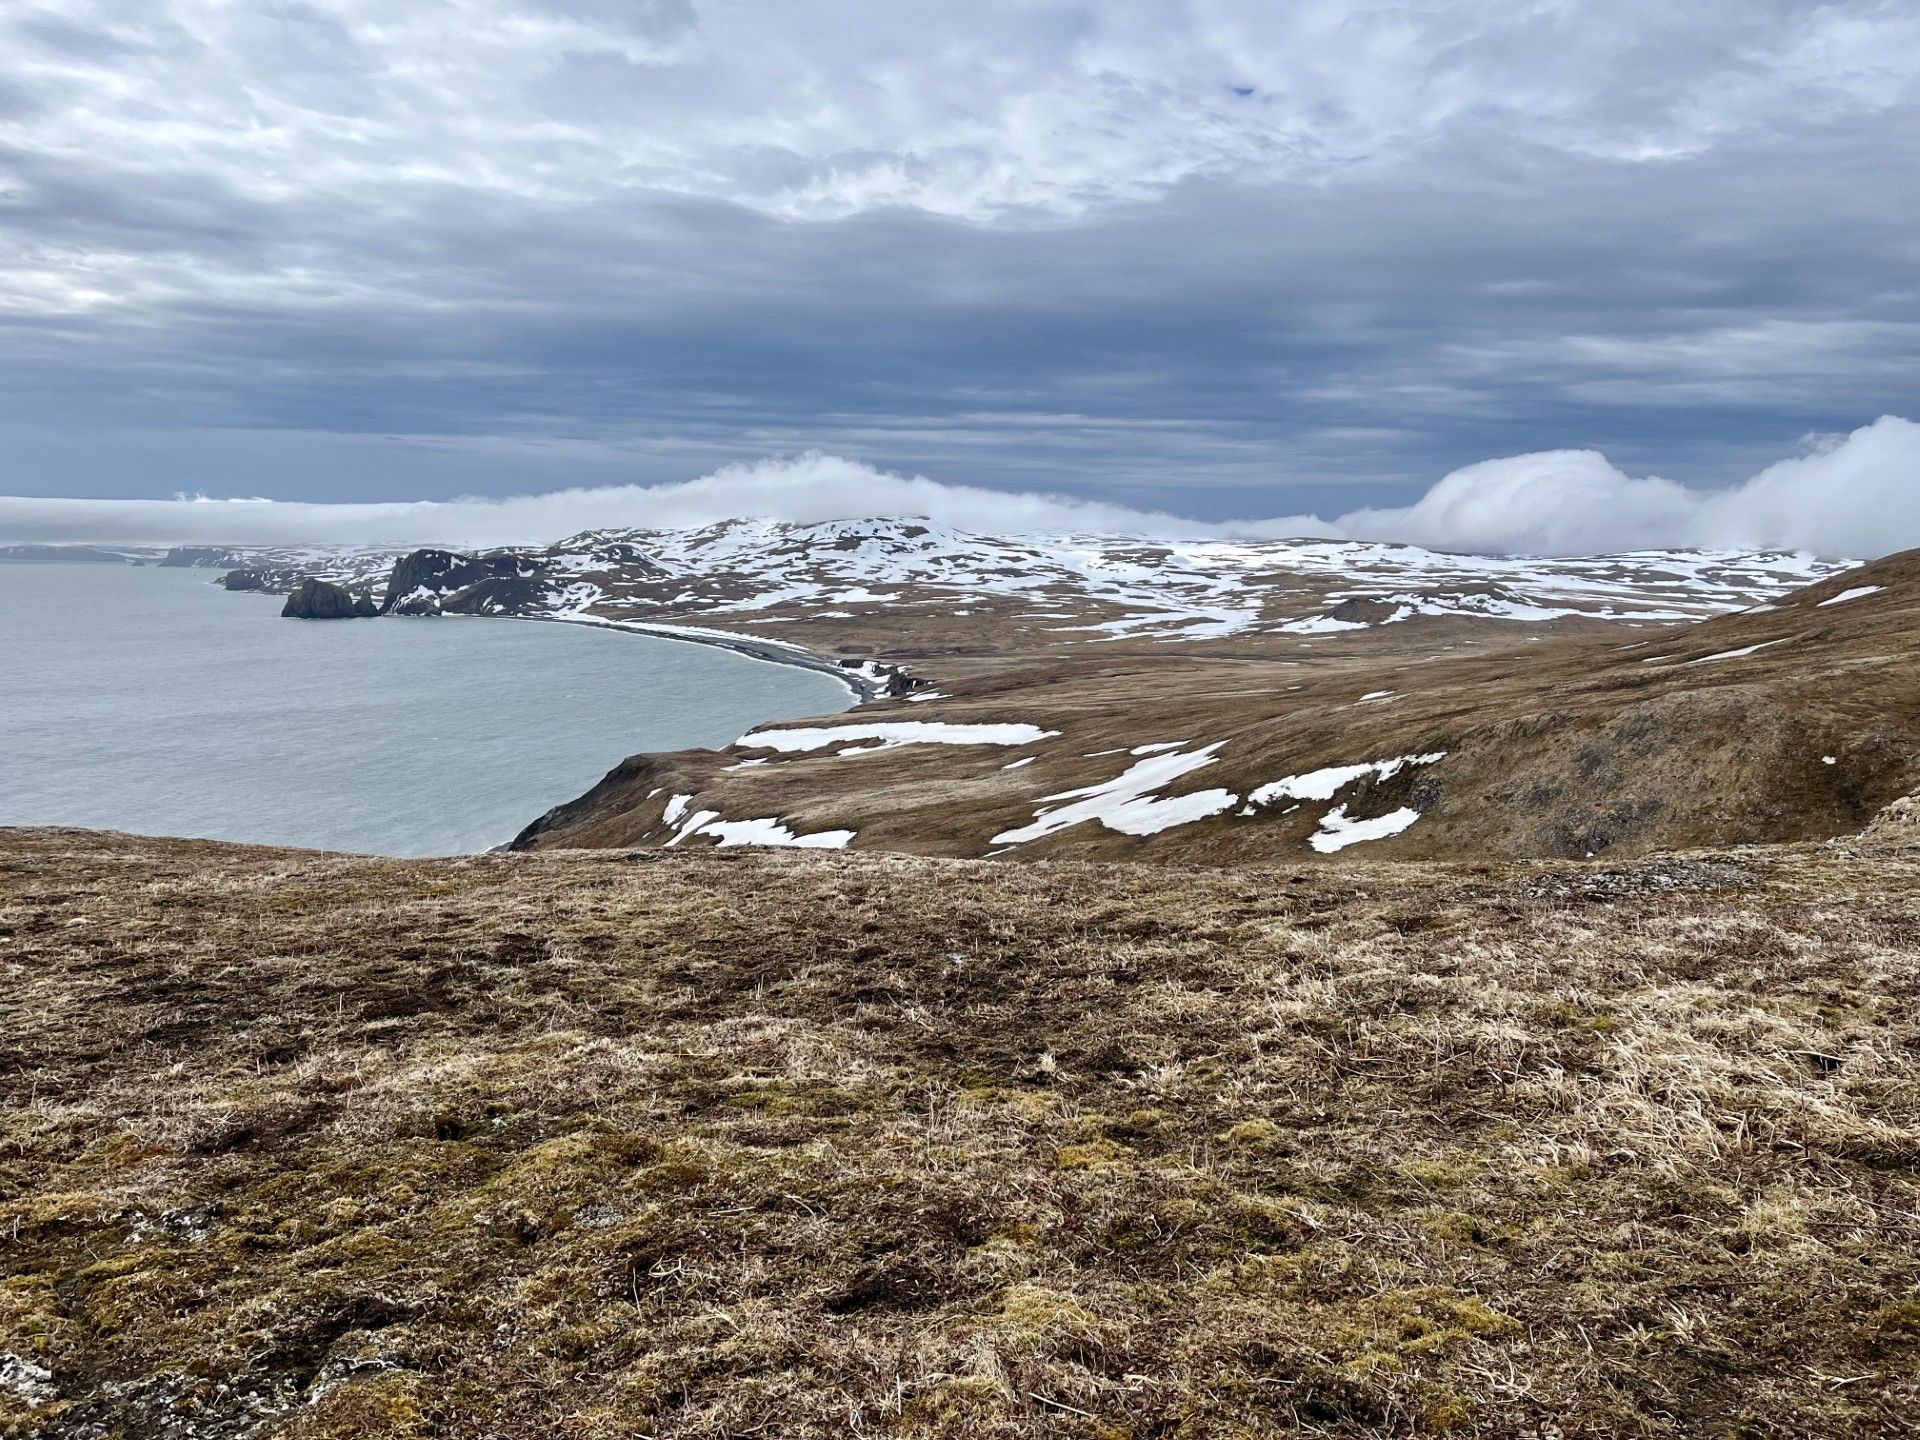
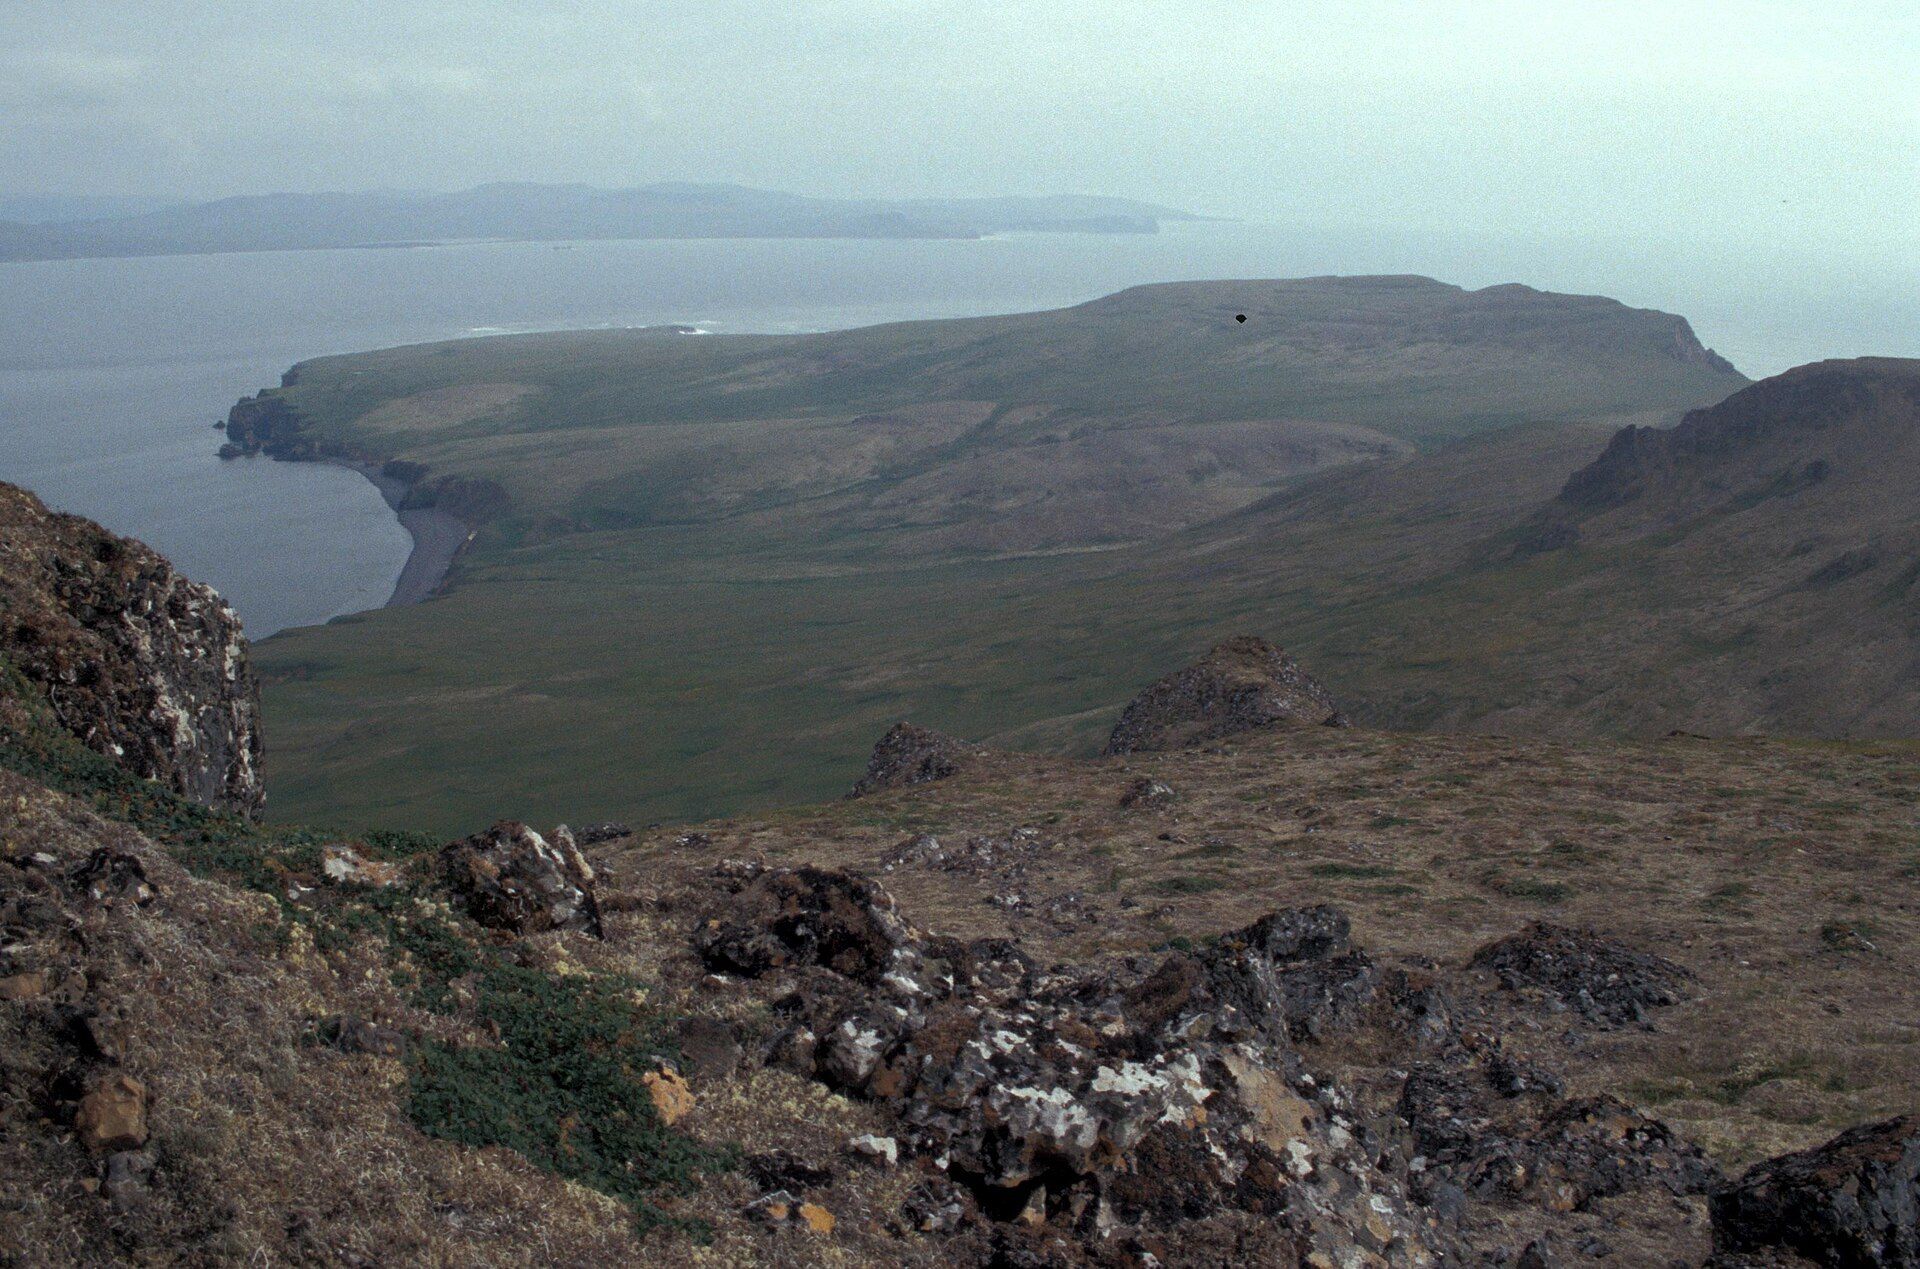
This is St. Matthew Island, Alaska. In 1944 the Coast Guard let 29 reindeer loose here.
The island had thick lichen to eat and no wolves. Watch what the herd did next.
Photo: Laura McDuffie, U.S. Geological Survey
PART 2 · QUESTION 5
Run the island. Stop at three years.
1
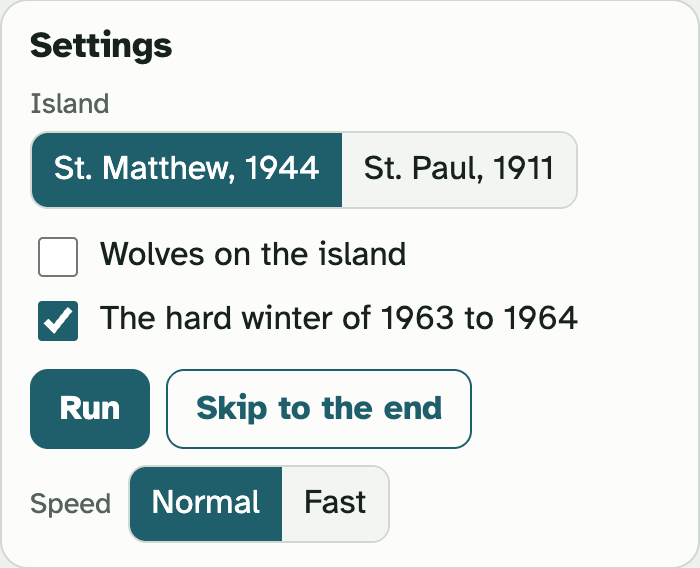
Go to Tab 2. Keep the island on St. Matthew, 1944.
2
Press Run. Watch the box in the corner. It shows the year and the reindeer.
3
Press Pause when the year is 1957. Write the reindeer in the Model row.
4
Press Keep going. Pause again at 1963 and at 1966.
5
Missed a year? Let it finish. Then press Run again.
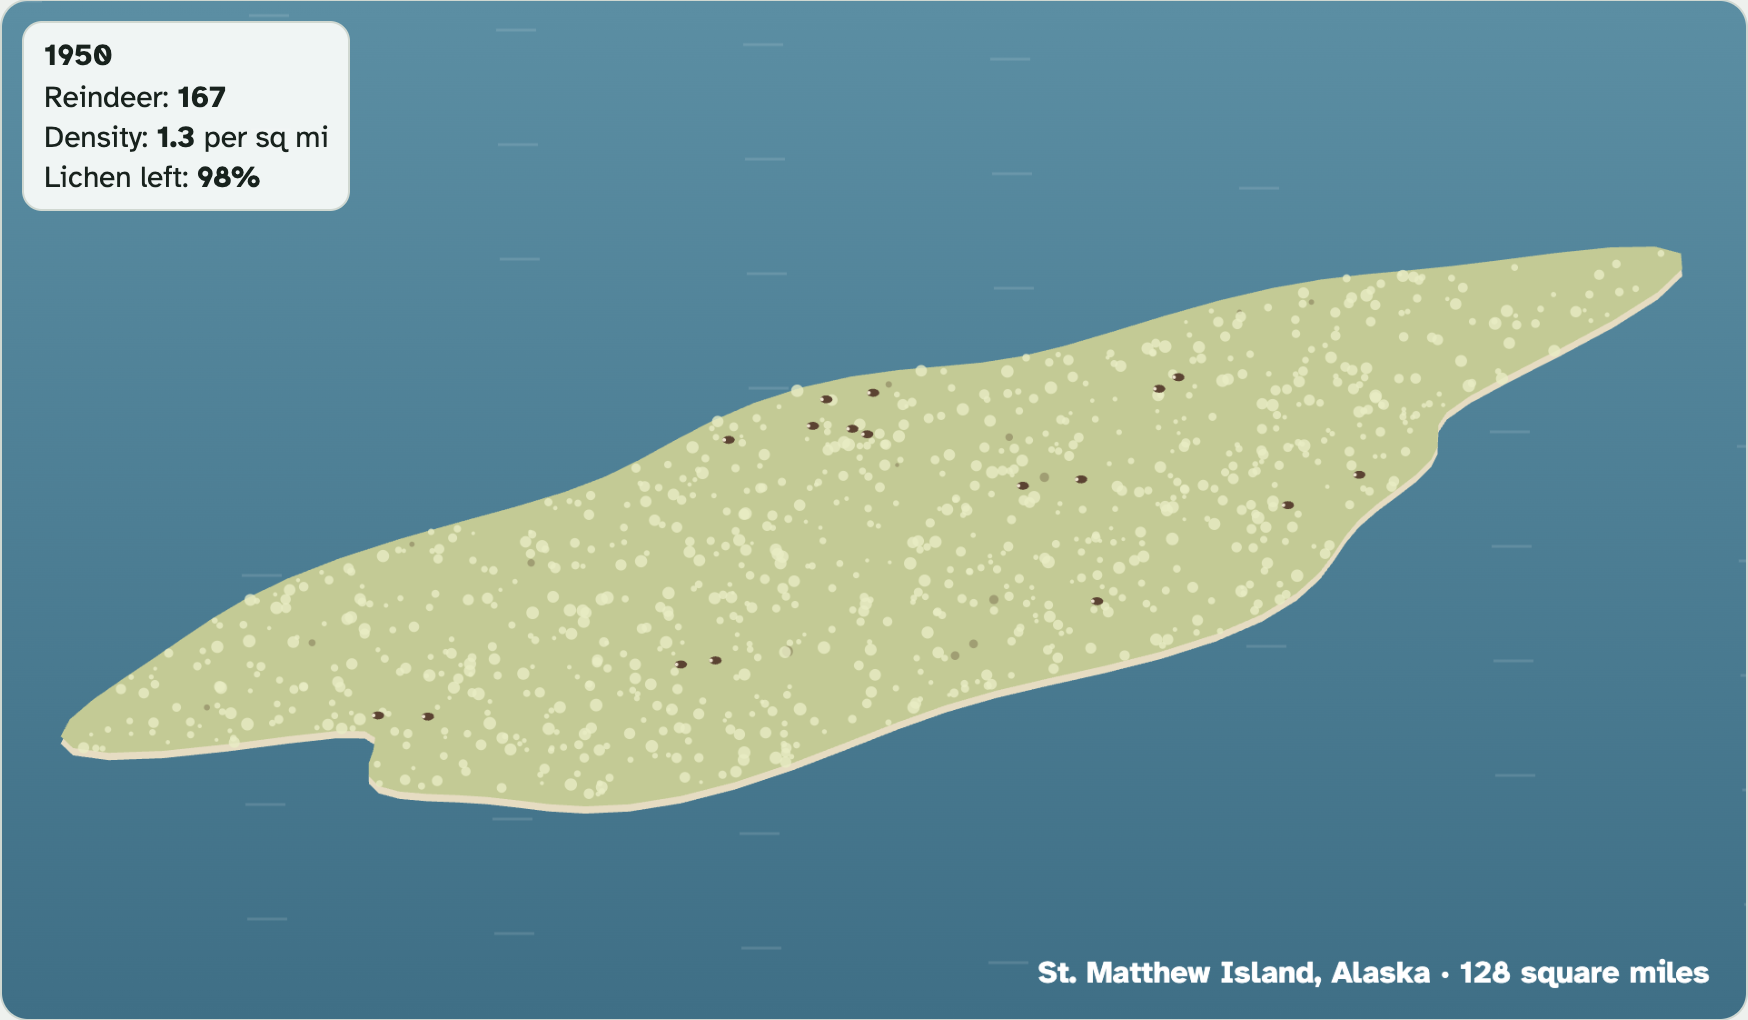
Each dot stands for 10 reindeer.
The black dots on the graph are the real counts.
Keep Speed on Normal. Fast is hard to pause.
Screenshots: mrsajdak.com/populations, Tab 2
PART 2 · QUESTION 6
How far past the limit?
1
Find Your runs. Read the number under Highest (year). That is the highest count.
2
Divide it by 128 square miles. That is the density.
3
Look under the graph. The orange dotted line is the carrying capacity. Read its number.
4
Divide the highest count by the carrying capacity.
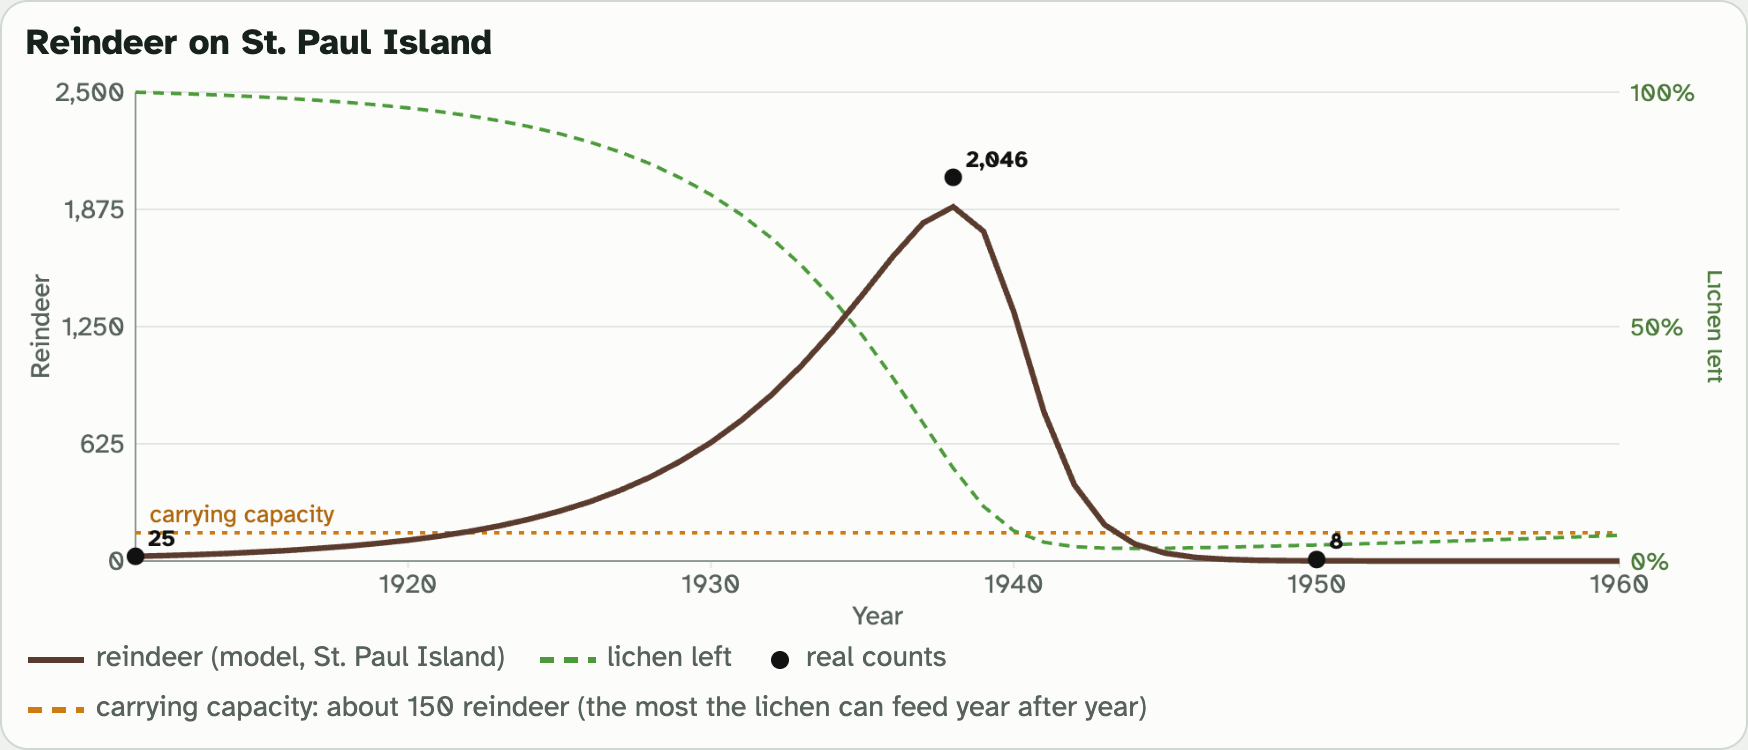
This graph is the other island, St. Paul. Yours will look different.
Example
3,000 ÷ 200 = 15
A herd of 3,000 on land that can feed 200 is 15 times too big. Not your numbers.
Screenshot: mrsajdak.com/populations, Tab 2
PART 2 · QUESTIONS 7 TO 9
Find the real limit
QUESTION 7
Lichen
The food
Run St. Matthew again. Watch Lichen left in the corner box.
What happened to the lichen before the crash? Read the note under the picture. What did the island not have?
QUESTION 8
Winter
Take the winter away
Uncheck The hard winter of 1963 to 1964. Run it. Pause at 1966.
Did the herd still crash? Was the real limit the winter or the food?
QUESTION 9
Wolves
Add a predator
Check the hard winter again. Check Wolves on the island. Run it.
What shape is the reindeer line now? What happens to the lichen? Why?
TAB 3 · QUESTIONS 10 TO 13
Part 3. Trout tanks
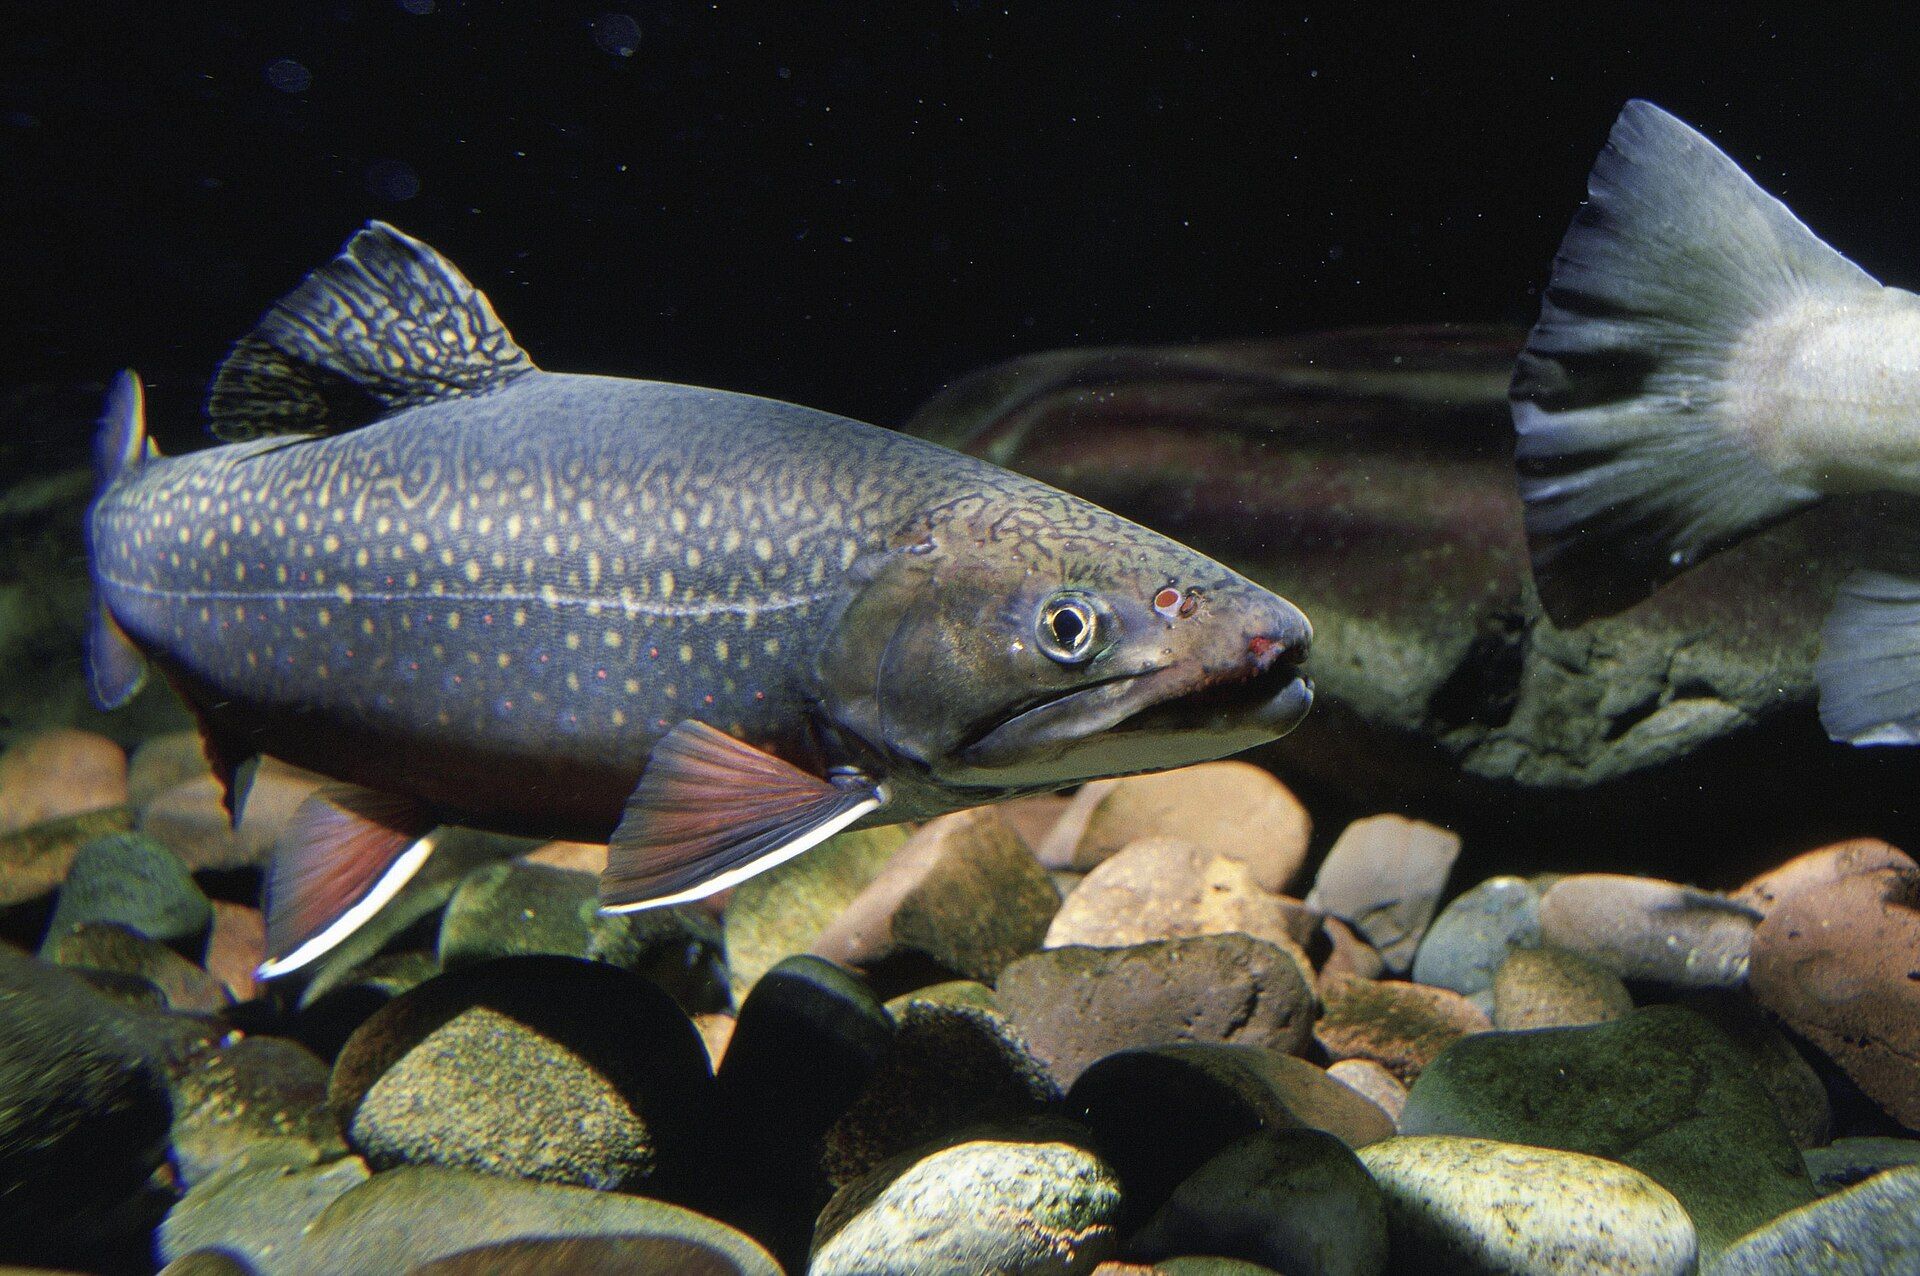
The brook trout is New York’s state fish.
pH tells how acid water is. Low pH is acid. You will test 13 tanks. Only the pH is different.
Photo: Eric Engbretson, U.S. Fish and Wildlife Service
PART 3 · QUESTION 10
Run the tanks for 30 days
1
Go to Tab 3. There are 13 tanks. Each one starts with 20 trout.
2
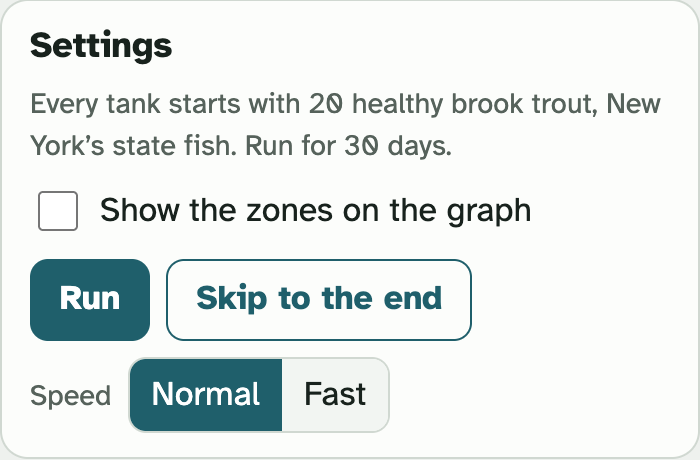
Press Run. Or press Skip to the end.
3
Wait for Day 30 of 30 in the corner box.
4
Read the number above each tank. Or use the table in Your runs.
5
Write how many are alive under each pH.
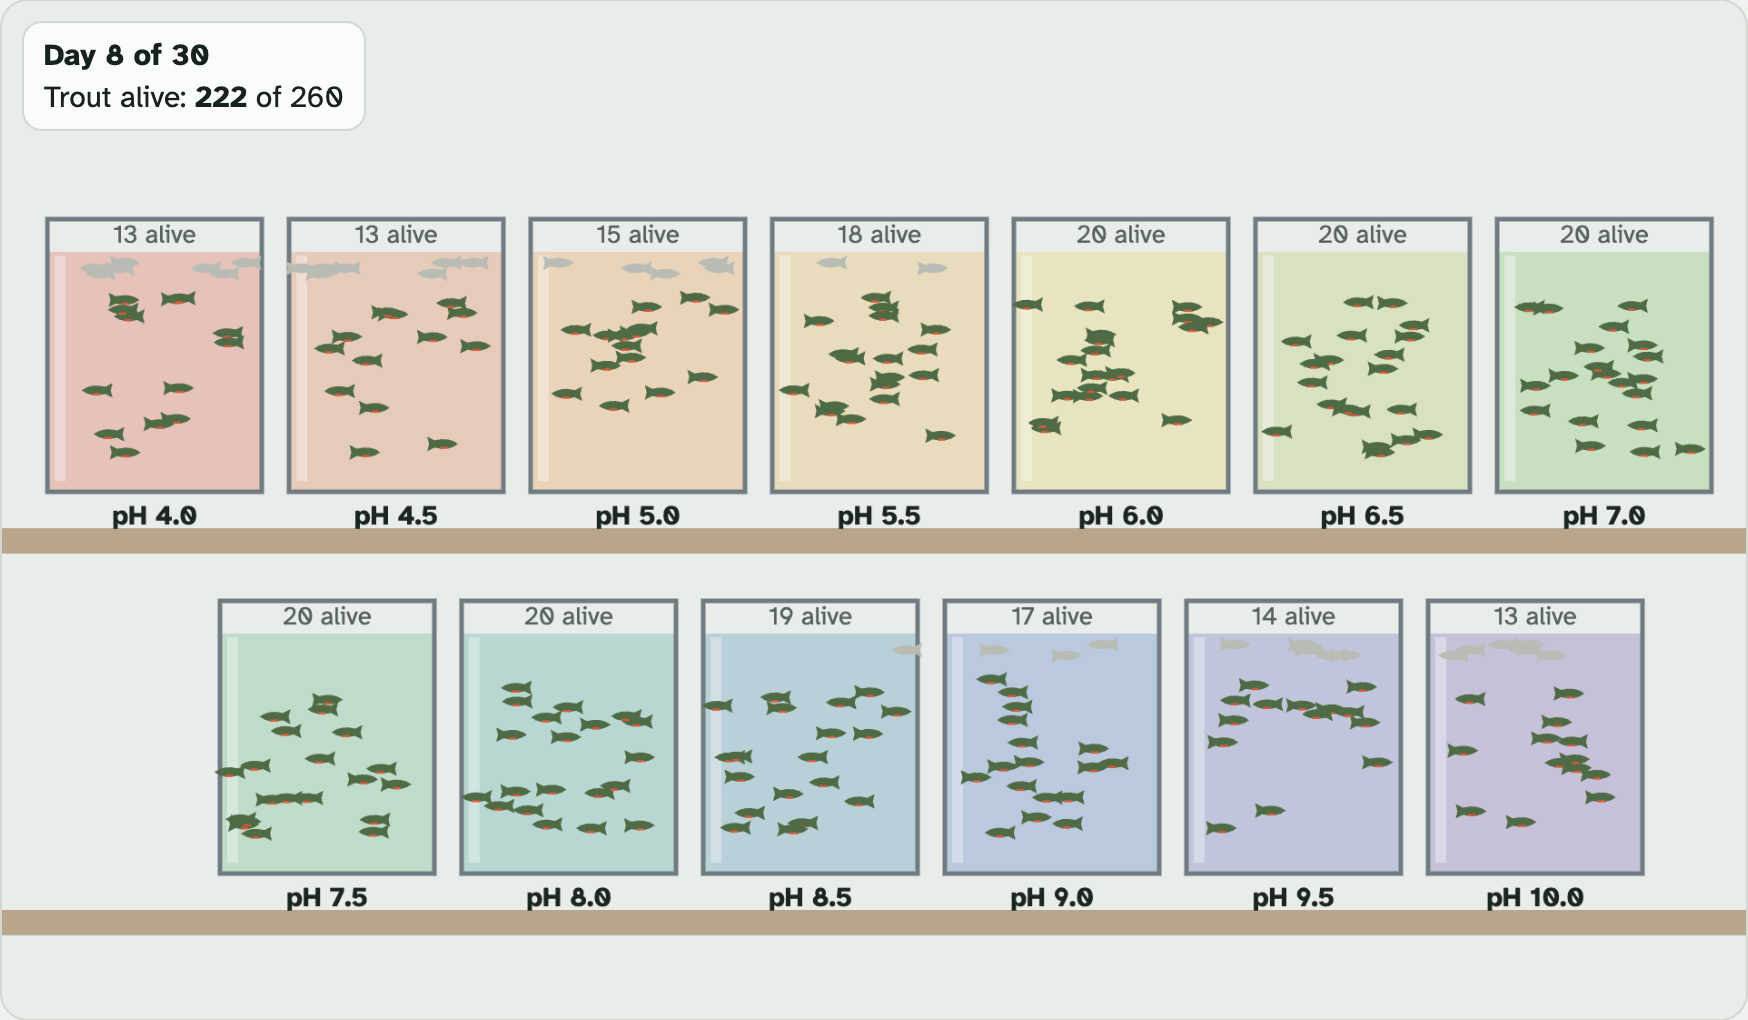
This picture is day 8, not day 30. Gray fish at the top have died.
Screenshot: mrsajdak.com/populations, Tab 3
PART 3 · QUESTION 11
The range of tolerance
Optimum range
The pH where the trout do best.
Zone of stress
Some trout live. Some die. The pH is a little too low or too high.
No survivors
The pH is much too low or too high. No trout live.
Check Show the zones on the graph. Read the pH numbers under each zone. Fill in the blanks.
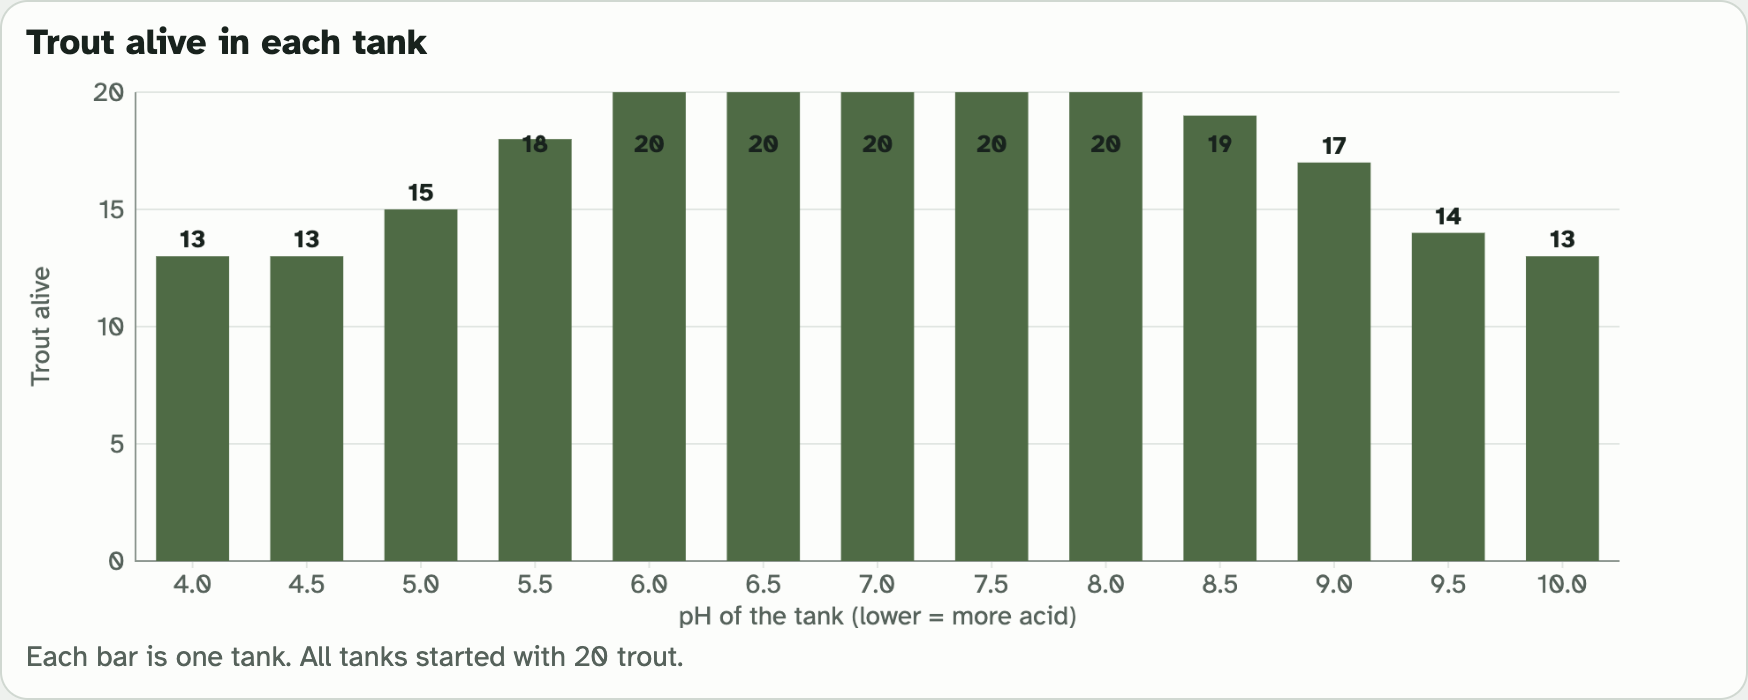
The zones show up as color bands behind the bars.
Screenshots: mrsajdak.com/populations, Tab 3
PART 3 · QUESTIONS 12 AND 13
One cause, and a real lake
QUESTION 12
Why is this good evidence?
Read the note under the tanks. List what was the same in every tank.
How many things were different? Why does that matter?
QUESTION 13
Acid rain in the Adirondacks
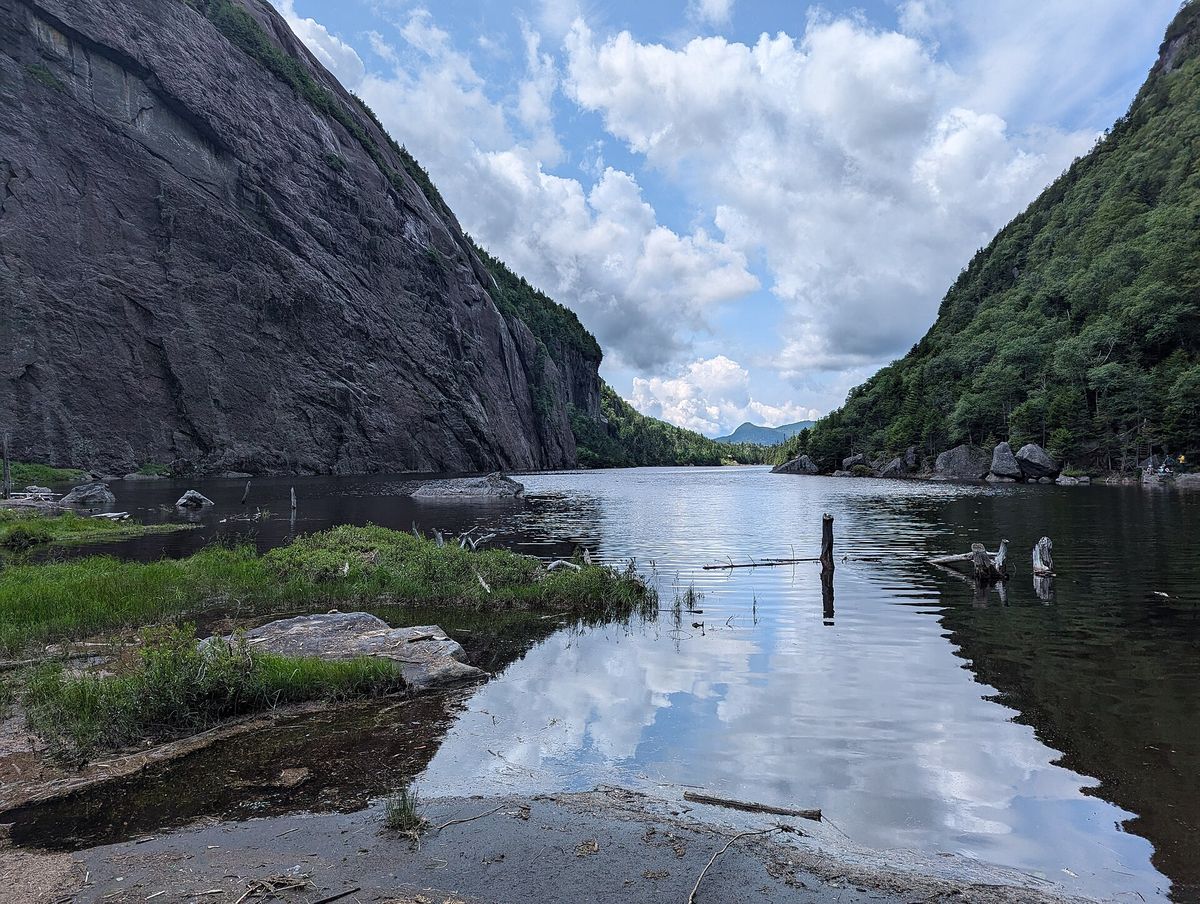
Acid rain has pushed some Adirondack lakes down to about pH 4.8.
Find the two tanks closest to 4.8. Use their numbers to predict what happens to the trout.
Photo: G. Edward Johnson, CC BY 4.0
TAB 4 · QUESTIONS 14 AND 15
Part 4. Life strategies
Some animals have a few young and take care of them. Some have thousands and leave.
You will follow 1,000 newborns of three species. Then you will see which one bounces back fastest.
Photo: Neal Herbert, National Park Service
PART 4 · TAB 4
Three ways to raise young
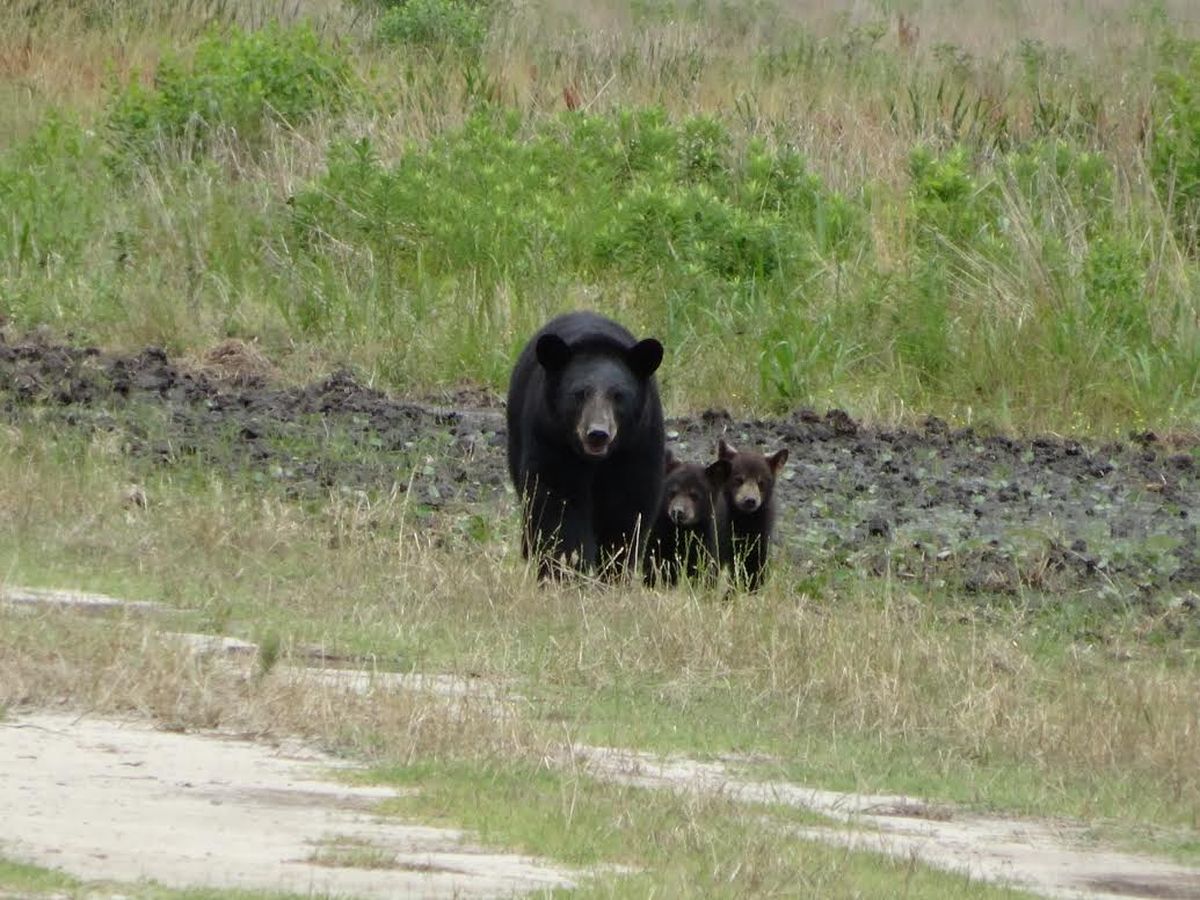
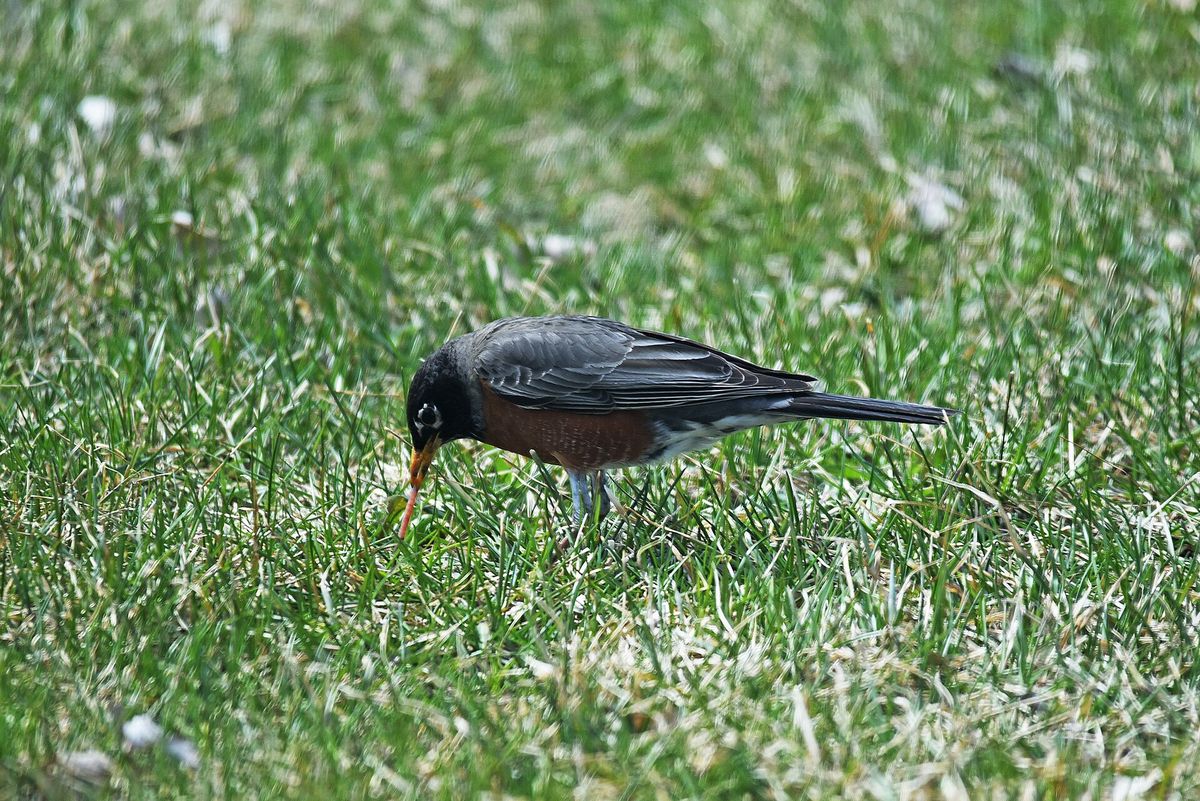
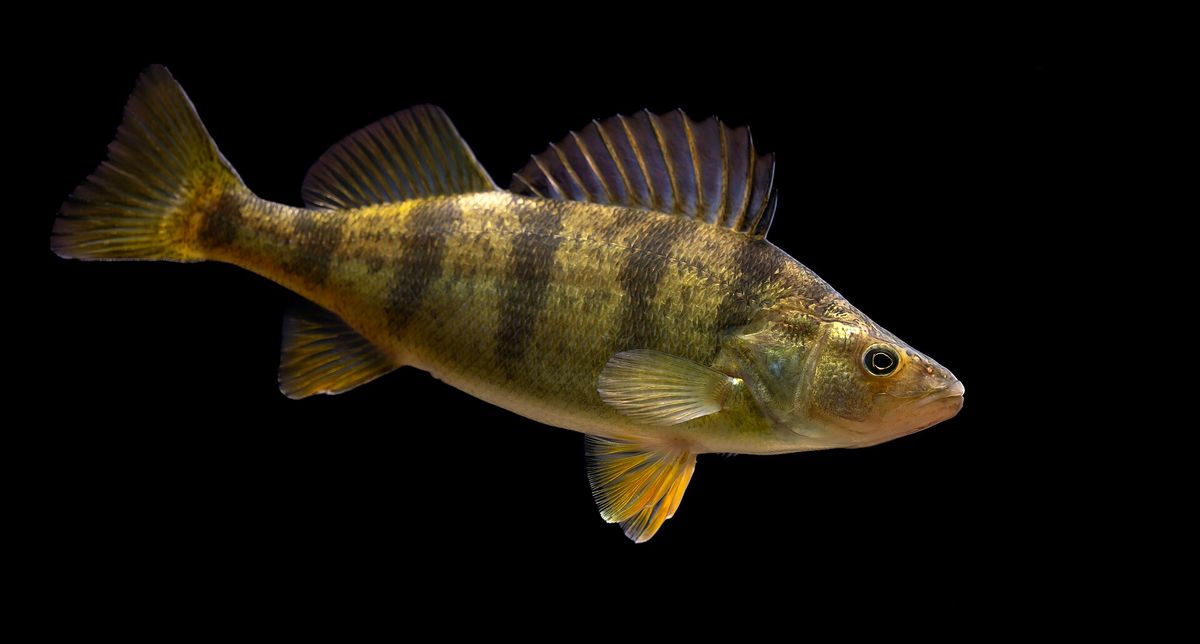
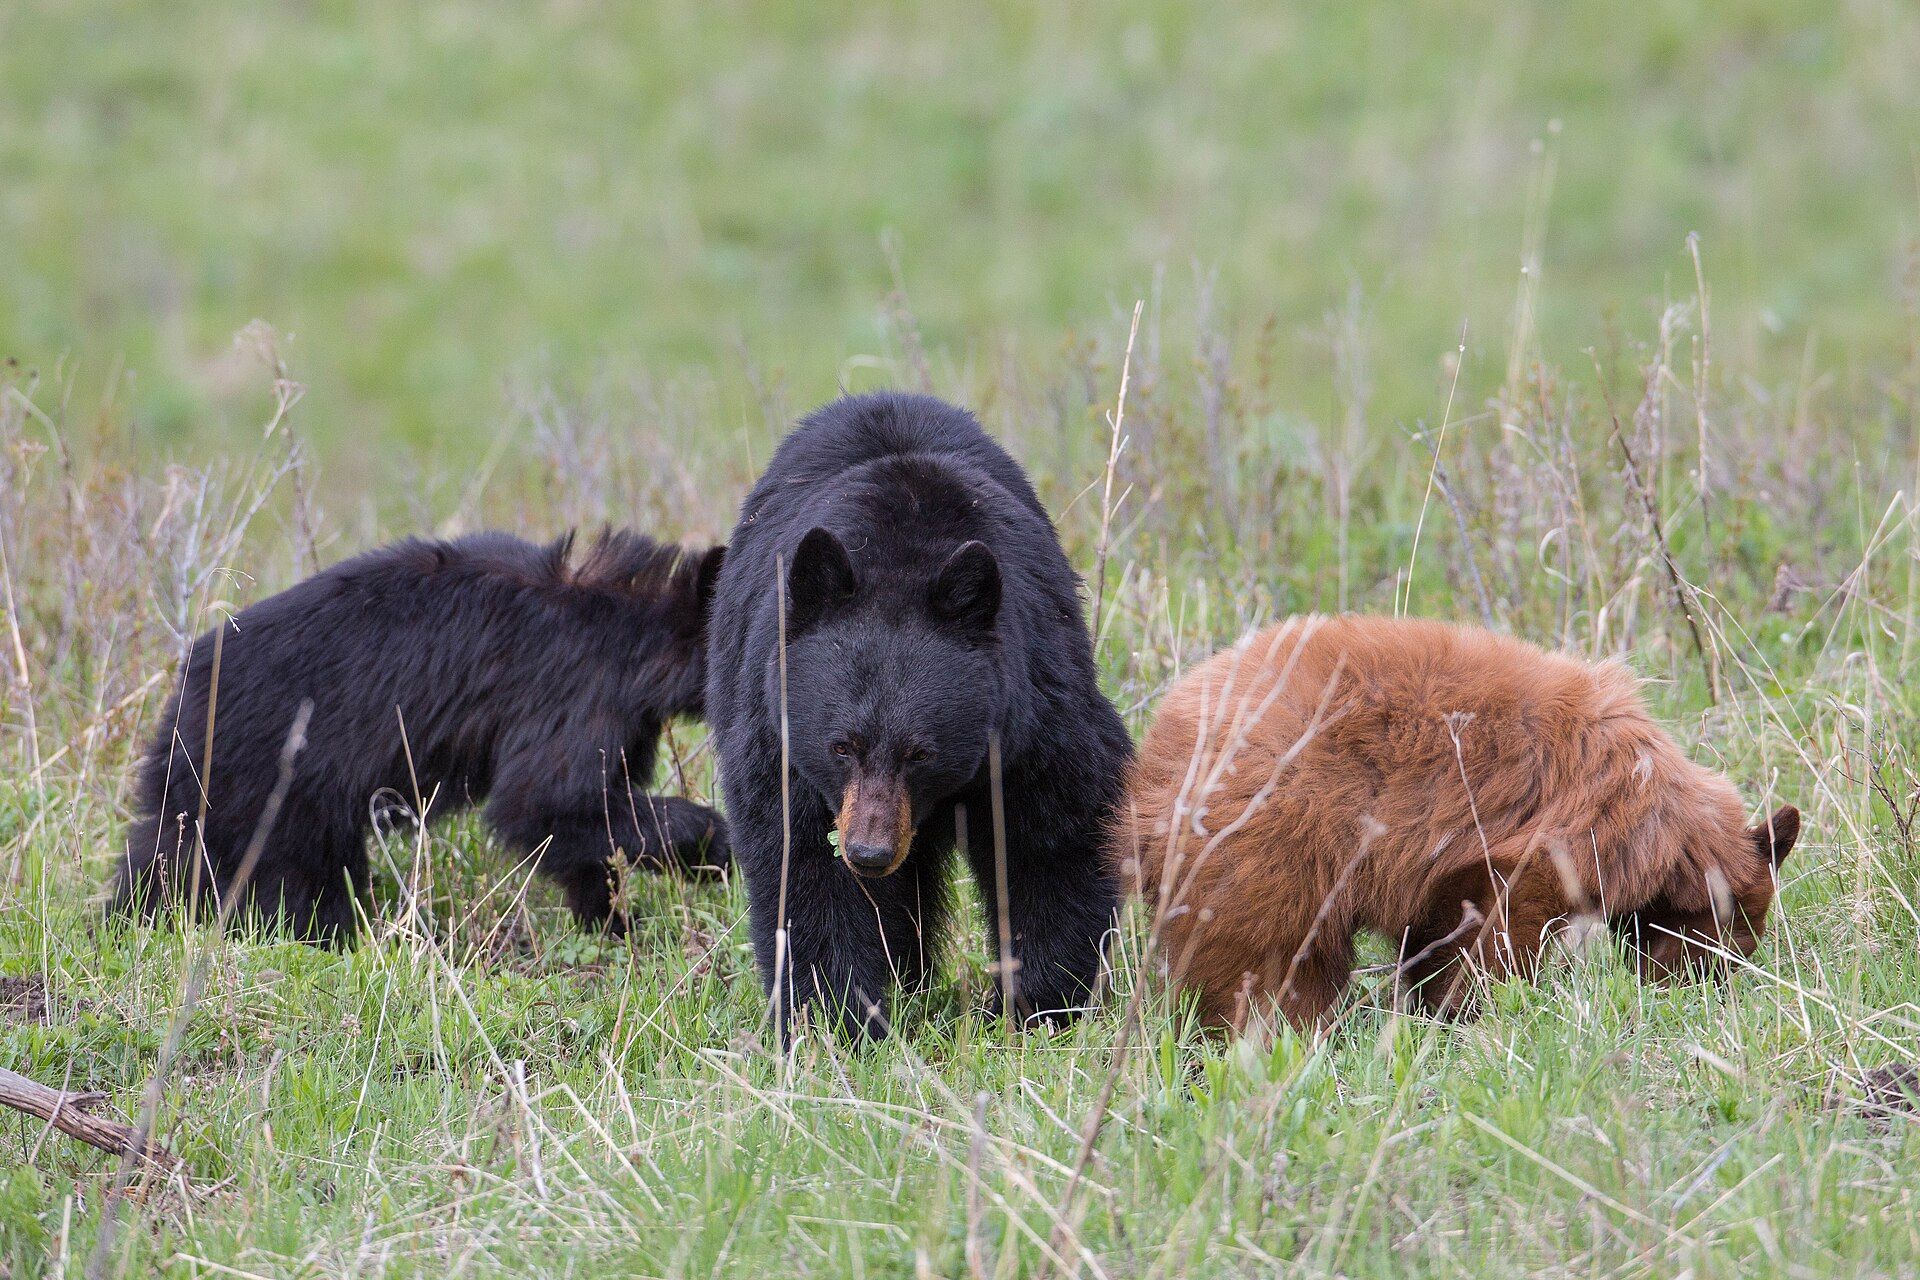
r-selected: many young, little care. K-selected: few young, lots of care. Which is which?
Photos: U.S. Fish and Wildlife Service
PART 4 · QUESTION 14
Follow 1,000 newborns
1
Go to Tab 4. Under What to watch, pick Survivorship. Press Skip to the end.
2
In Your runs, copy Alive at 10% and at 50% for each species.
3
Pick Recovery. Press Skip to the end. Copy the years to get back to 90%.
4
Look at the three lines on the Survivorship graph. Name each curve type.
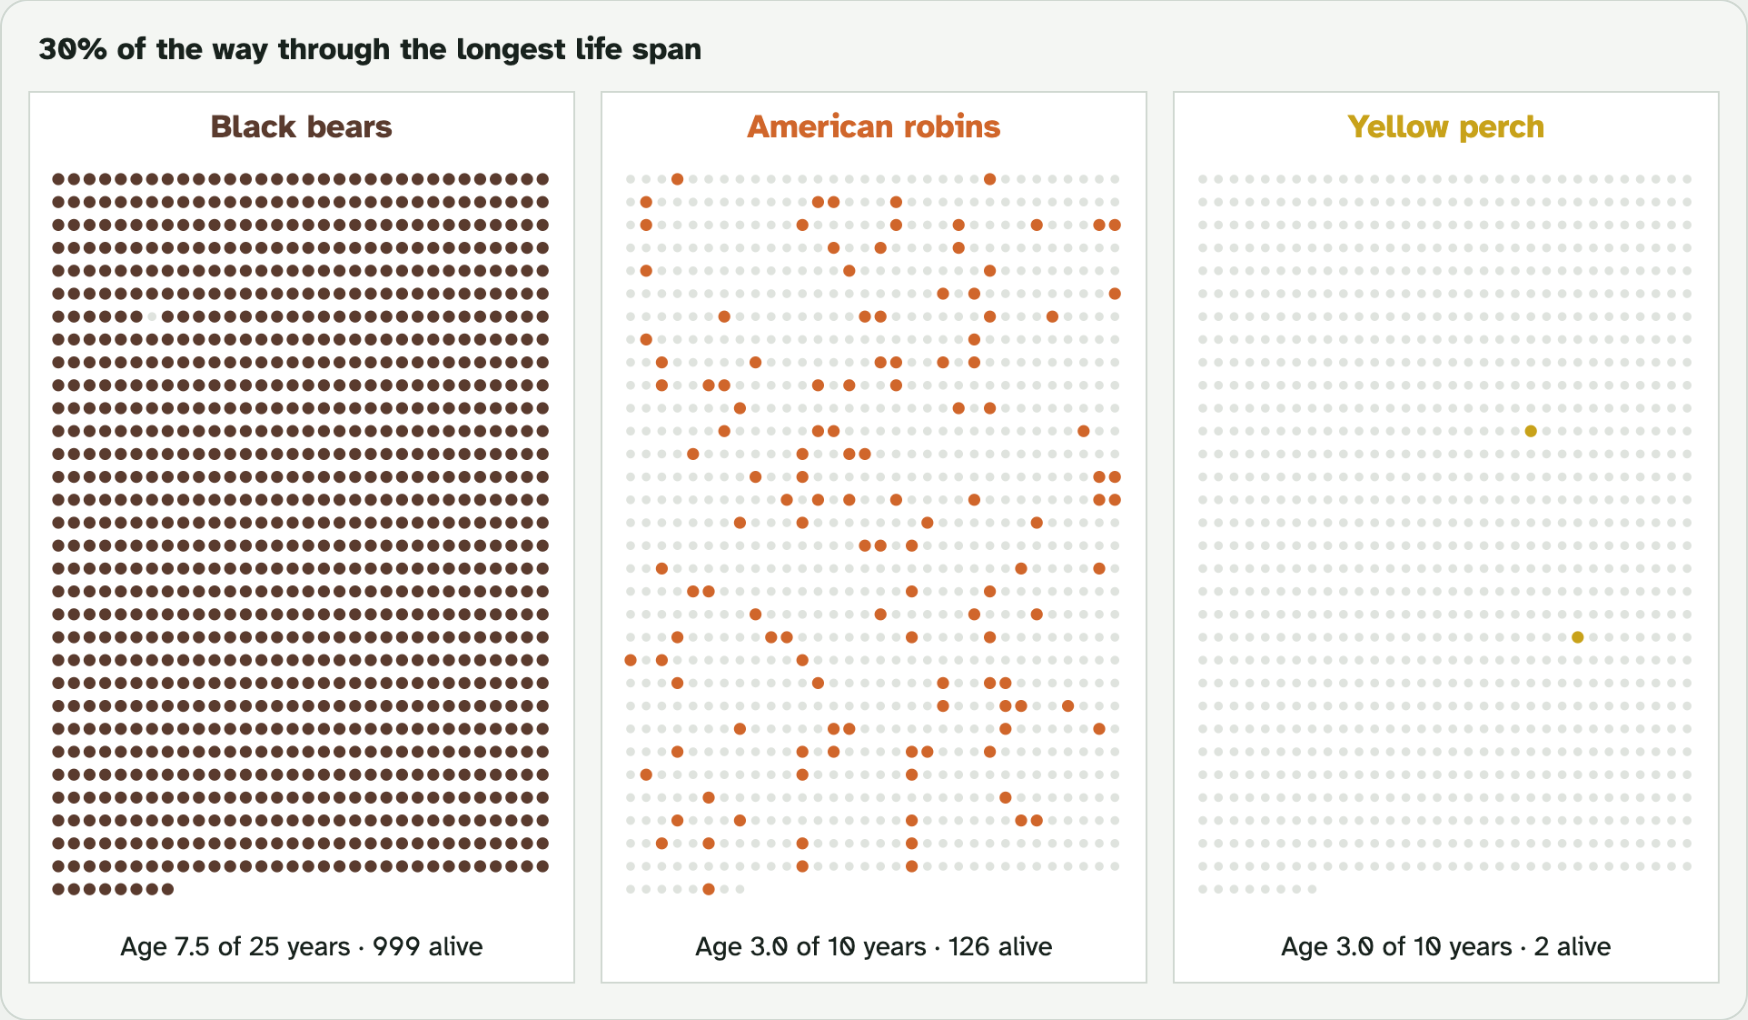
| Late loss | Most live to old age. |
| Constant loss | About the same share die at every age. |
| Early loss | Most die very young. A few live long. |
Screenshot: mrsajdak.com/populations, Tab 4
PART 4 · QUESTION 15
Who is most at risk?
The question
A disease kills most of the animals in all three populations in one year. Which species is most likely to go extinct?
Your numbers
Look at the recovery column in your Question 14 table. Compare the slowest species with the fastest.
One life fact
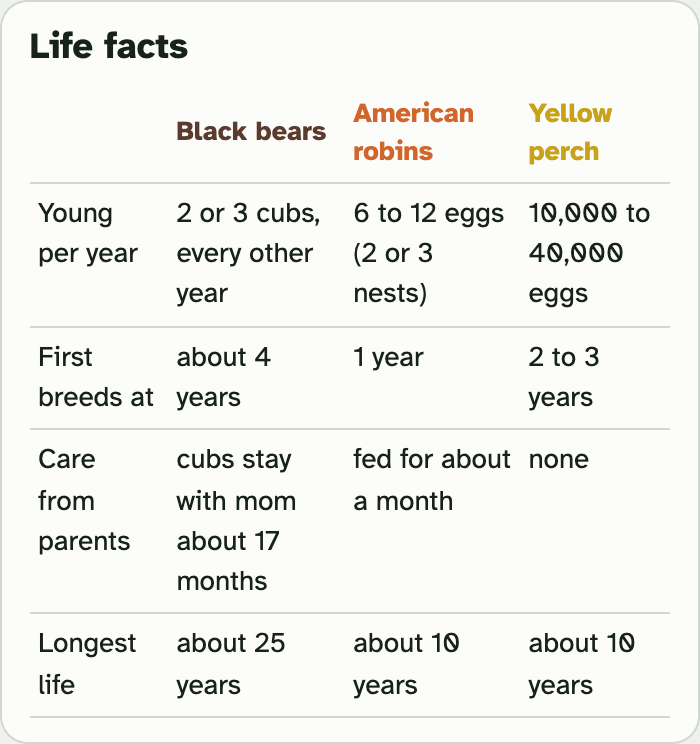
Find a fact in the Life facts box that explains why that species is so slow to come back.
Screenshot: mrsajdak.com/populations, Tab 4
WRAP IT UP · QUESTION 16
Can any population grow forever?
The claim
“No population can grow forever.”
Evidence 1
Pick one tab. Give a number that shows the population stopped growing, or crashed.
Evidence 2
Pick a different tab. Give a number from that one too.
Reasoning
What do the limits have in common? Think about what every habitat has only so much of.
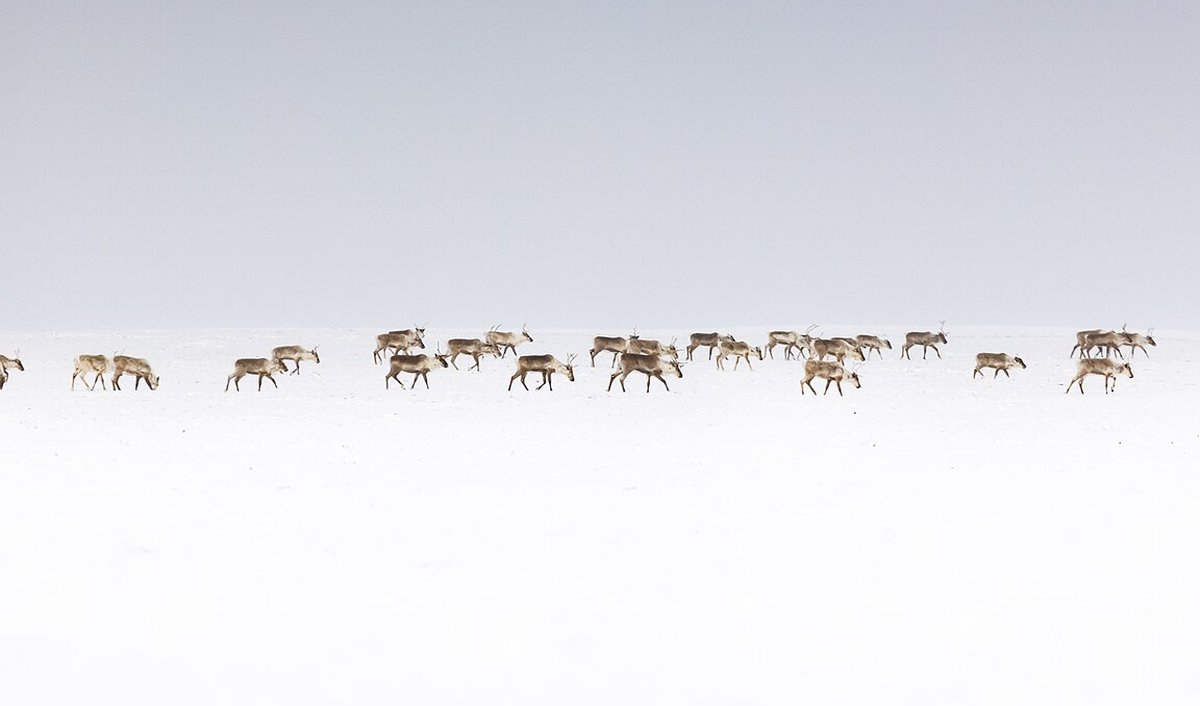
A caribou herd in Alaska. Caribou and reindeer are the same species.
Photo: U.S. Fish and Wildlife Service, Alaska
LAST CHECK
Before you hand it in
Name, date and period are on top.
All four tables are full.
Questions 2, 6 and 11 have every blank filled in.
Question 16 uses numbers from two different tabs.
Photo: Anne Morkill, U.S. Fish and Wildlife Service